
Fig. 1.
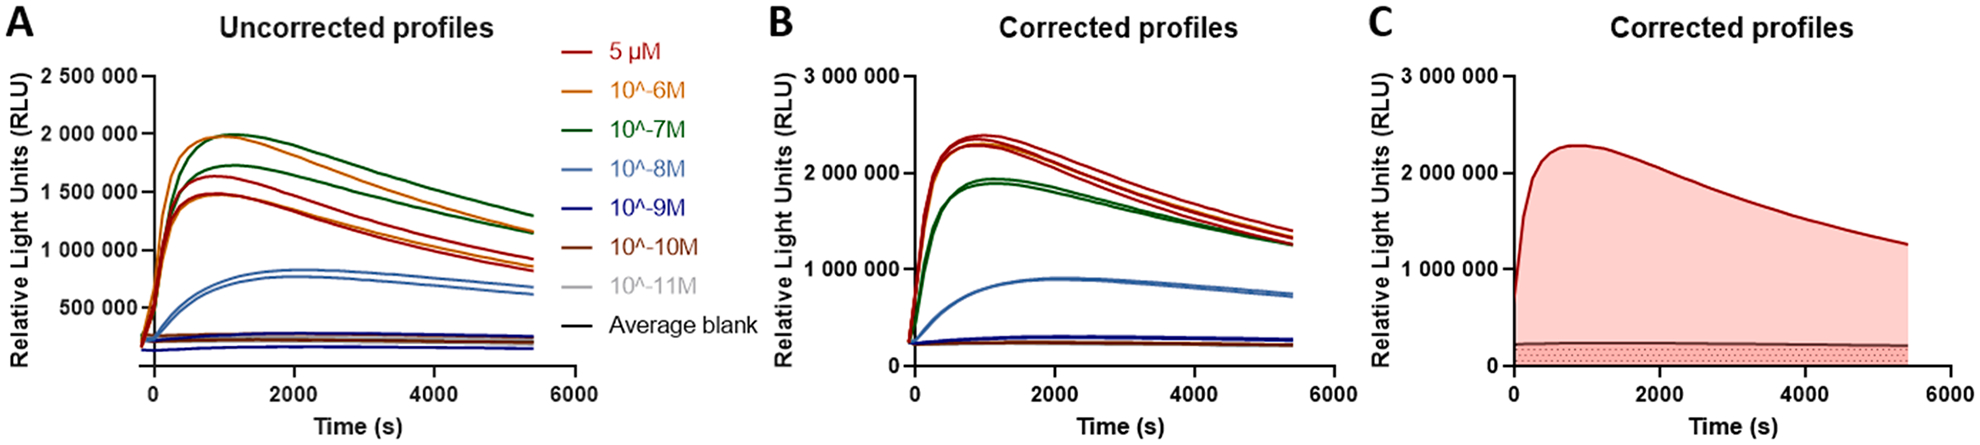
Example of the calculation of the area under the curve (AUC). (A) Raw activation profiles of compound 1 in the βarr2 bioassay. B) Profiles obtained by correcting for inter-well variability, and used to calculate the final AUC (panel C). The latter is calculated by subtracting the blank AUC (grey dotted area) from the total AUC for the curve (red region).