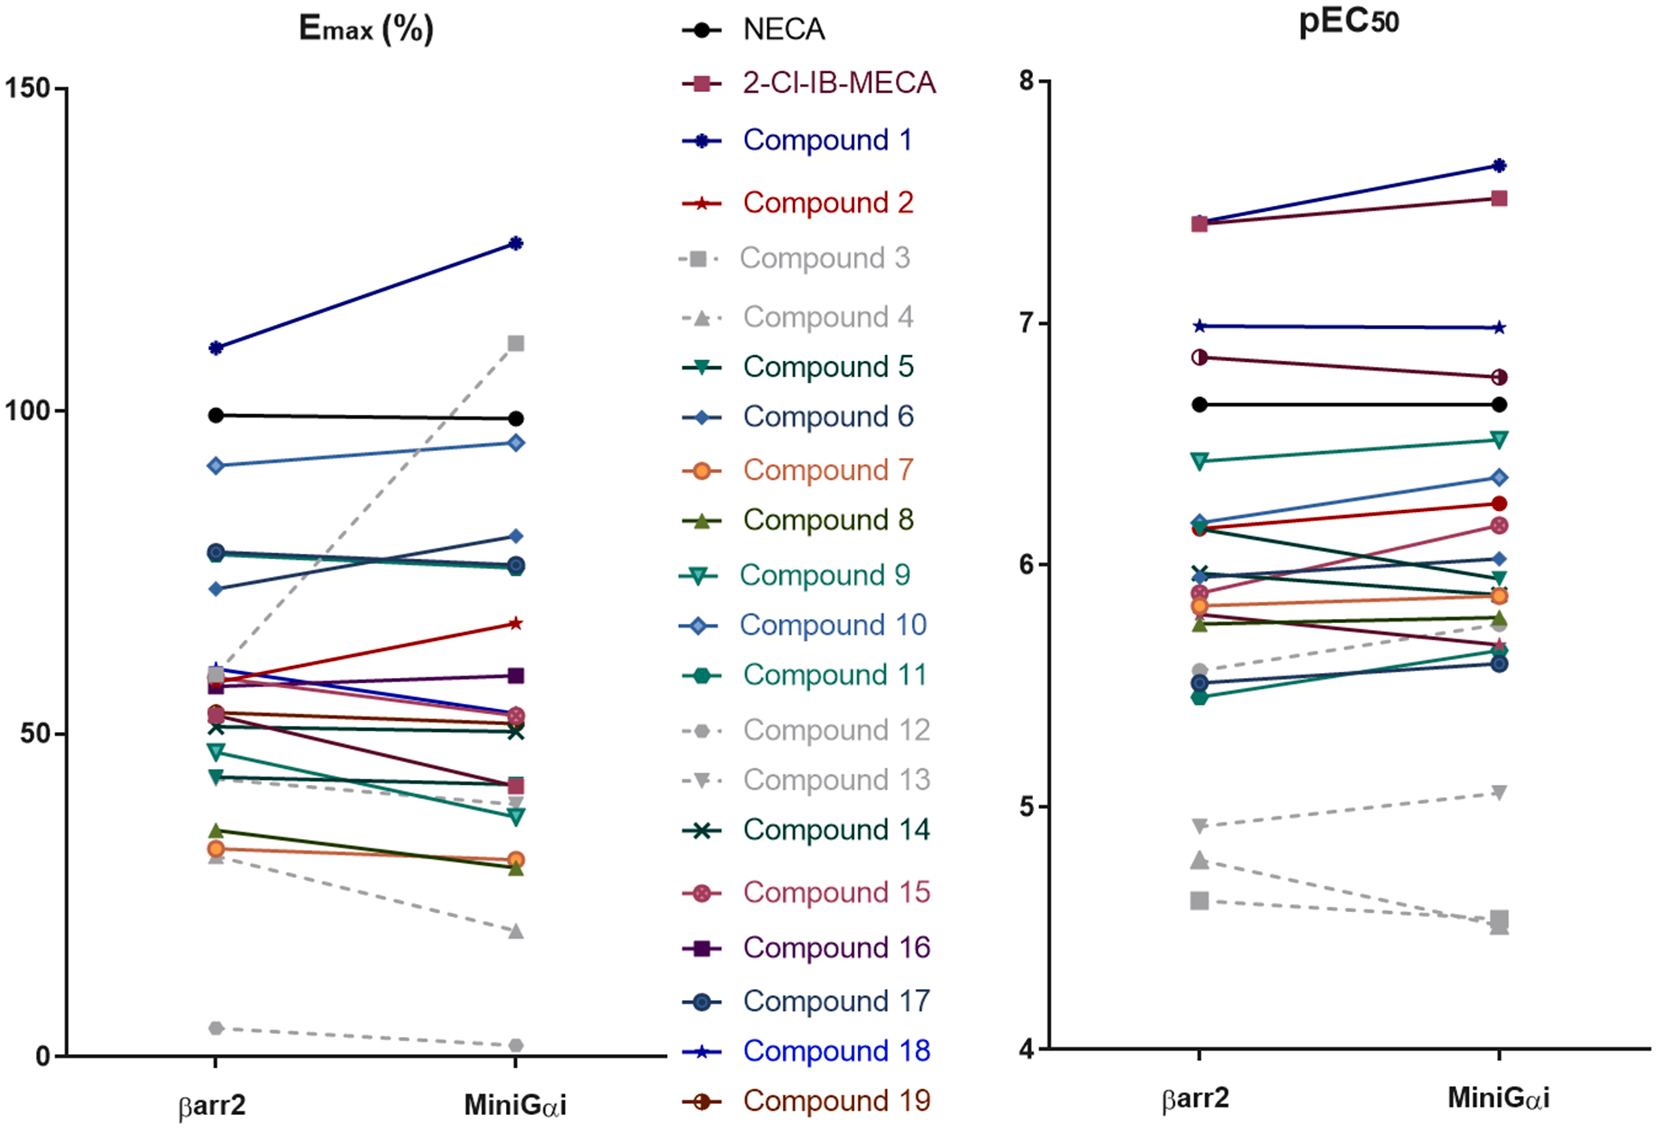
Fig. 5.

Comparison of the potencies (pEC50, right panel) and efficacies (Emax, left panel, normalized to Emax of reference agonist NECA that was arbitrarily set to 100%) of the compounds, assessed using the two bioassays. This is a visual representation of the potential bias of compounds towards one of the pathways. The compounds represented in grey dotted lines are those that did not reach the maximal response within the tested concentration range, as seen from the concentration–response curves.
