
Fig. 6.
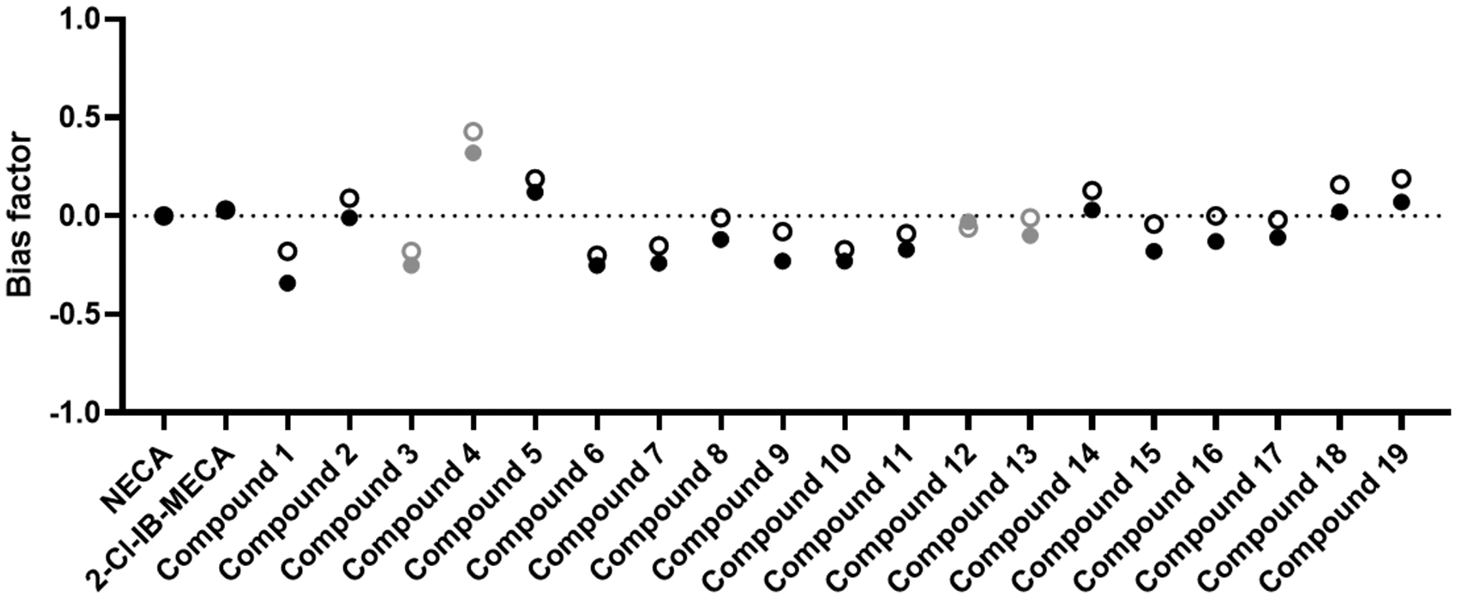
Visual representation of the bias factors calculated for each of the compounds. The closed circles represent the bias factors that were obtained using the full activation profiles (90 min), the open circles show the bias factors obtained by using only the ascending part of the activation curves (only the first 30 min of the read-out). A positive value would imply a preference towards the βarr2 pathway, a negative value a bias towards miniGαi as compared to the reference agonist NECA. Kruskal-Wallis analysis with post hoc Dunn’s test did not reveal statistical differences between the reference and the test compounds. The compounds represented in grey are those that did not reach the maximal response within the tested concentration range, as seen from the concentration-response curves. As this may impact the calculation of the bias factor β, no conclusions on the (non-) biased nature of these compounds can be drawn.