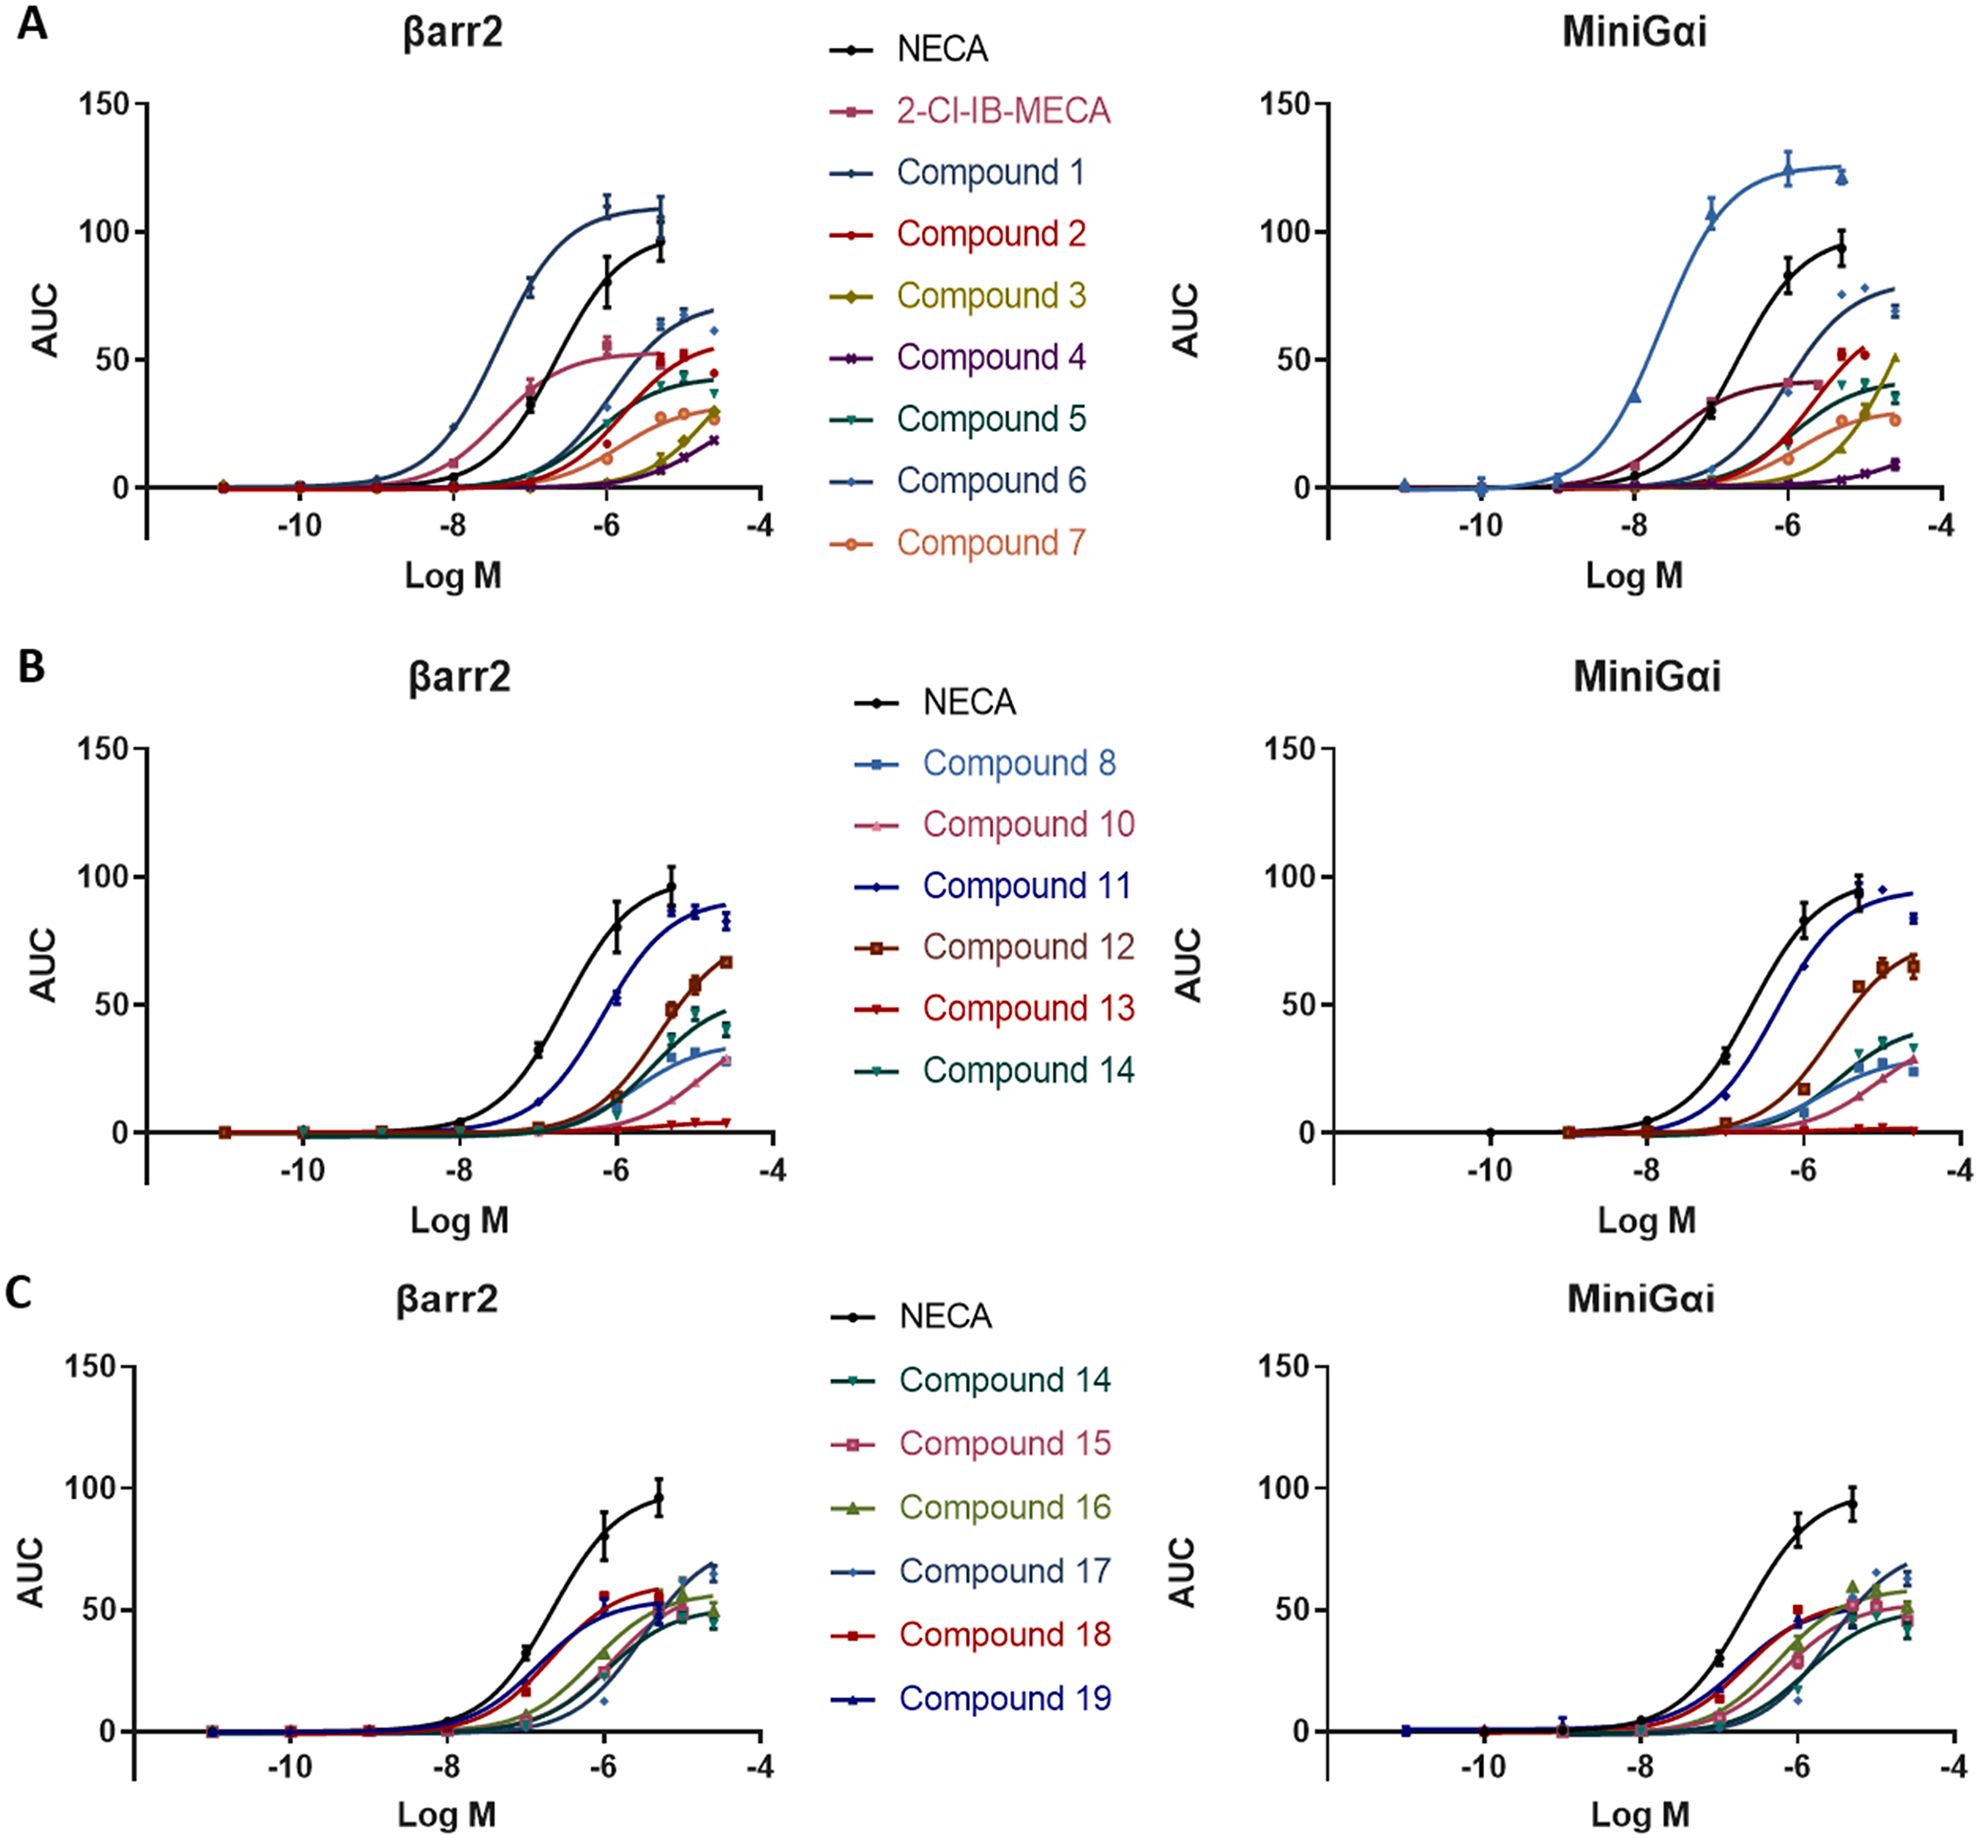
Fig. 8.

Each panel shows the sigmoidal concentration-response curves of a subset of the tested compounds, the left and right graphs showing the obtained results for βarr2 recruitment and miniGαi coupling to the A3AR. Curves are resulting from three independent experiments, each performed in duplicate.
