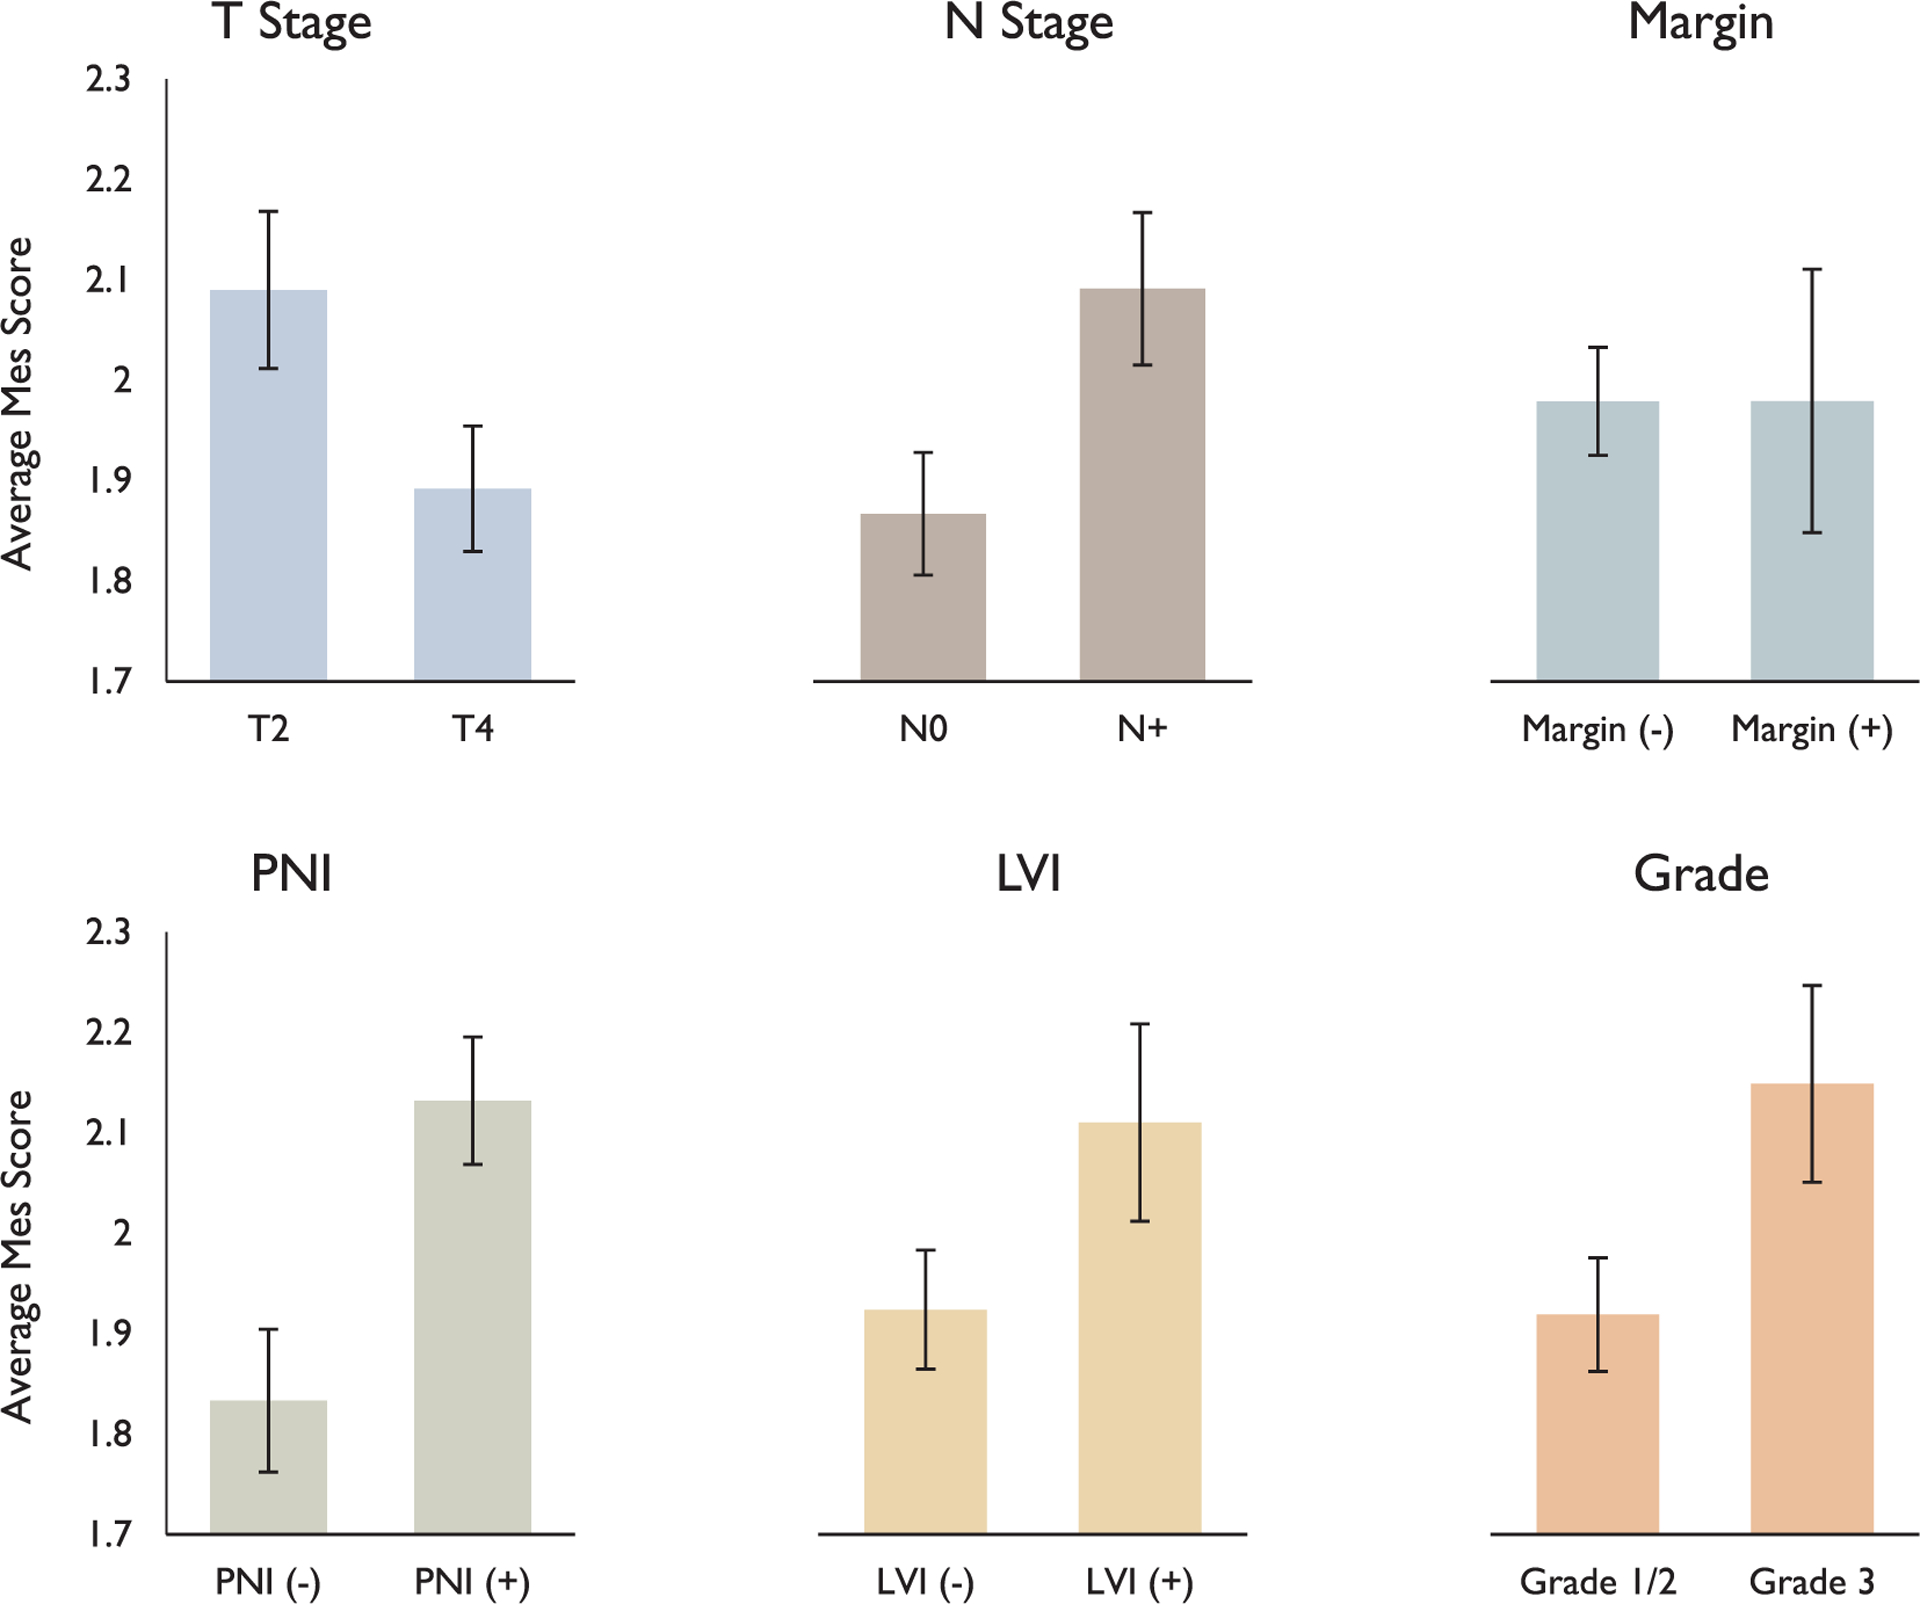
Fig. 2.

Association of mesenchymal scores with pathologic features. Bar plots demonstrate significant associations of p-EMT with T stage (p < 0.05), N stage (p = 0.02), PNI (p = 0.0003), and grade (p < 0.05), but not margin status (p = 0.99) or LVI (p = 0.11).
