Fig. 4.

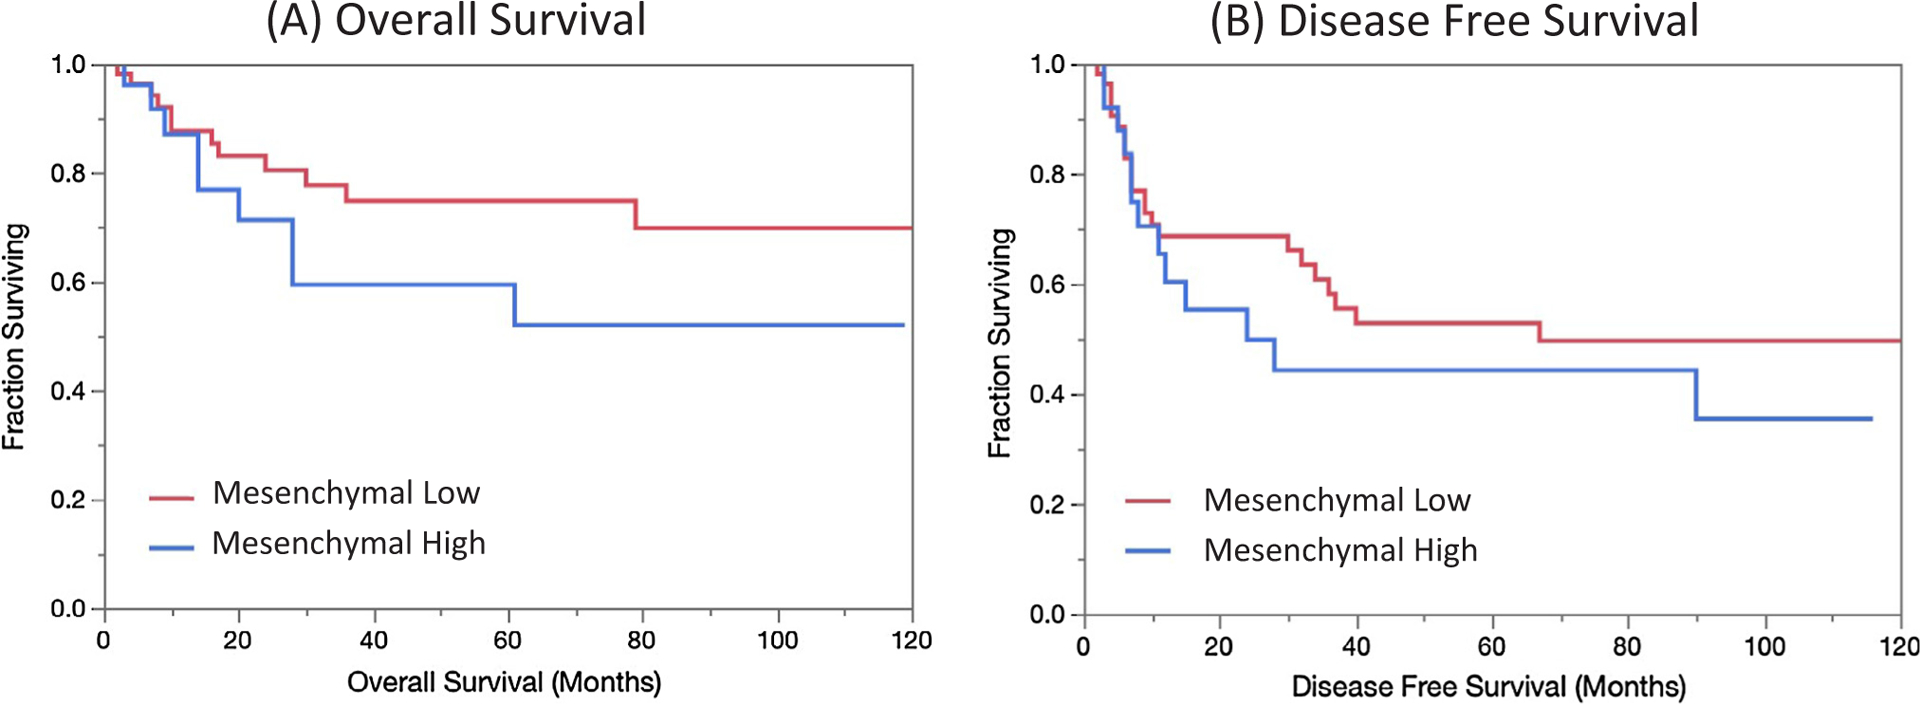
Survival analysis. Kaplan-Meier curves of overall (A, p = 0.19) and disease free (B, p = 0.39) survival stratified by mesenchymal classification demonstrate trends towards poorer survival outcomes in mesenchymal high patients.

Survival analysis. Kaplan-Meier curves of overall (A, p = 0.19) and disease free (B, p = 0.39) survival stratified by mesenchymal classification demonstrate trends towards poorer survival outcomes in mesenchymal high patients.