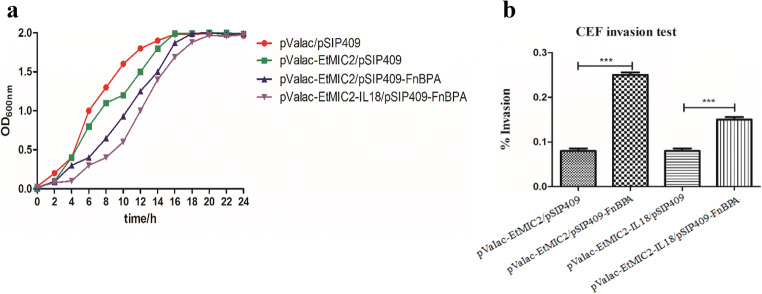
Fig. 3.
Growth curves and CEF invasion test. a Growth curves of the 4 strains and b determination of the invasion rates of the recombinant strains in vitro. By stimulating CEFs and counting the number of intracellular bacteria, the cell invasion rates were calculated. Statistically, P < 0.001 was statistically significant and marked as triple asterisks

