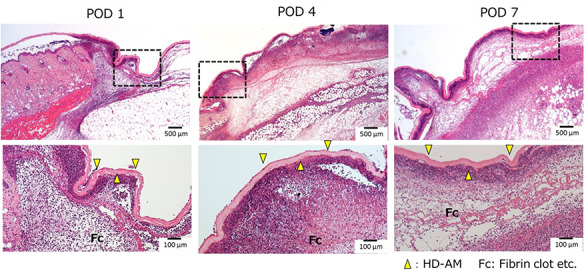
Figure 7.

Cell infiltration under HD-AM (Tissue 1). Cell infiltration was observed directly below the HD-AM using H&E staining (×25), (Top). The Bottom images (×100) show an enlargement of the elongated dotted frame in the top images (×25). The peak of cell infiltration was observed on POD 4. On POD 7, in Tissue 1, cell infiltration was decreased but there was an active formation of granulated tissue in Tissue 3. Yellow arrows: HD-AM. HD-AM hyperdry human amniotic membrane, H&E hematoxylin and eosin, POD postoperative day
