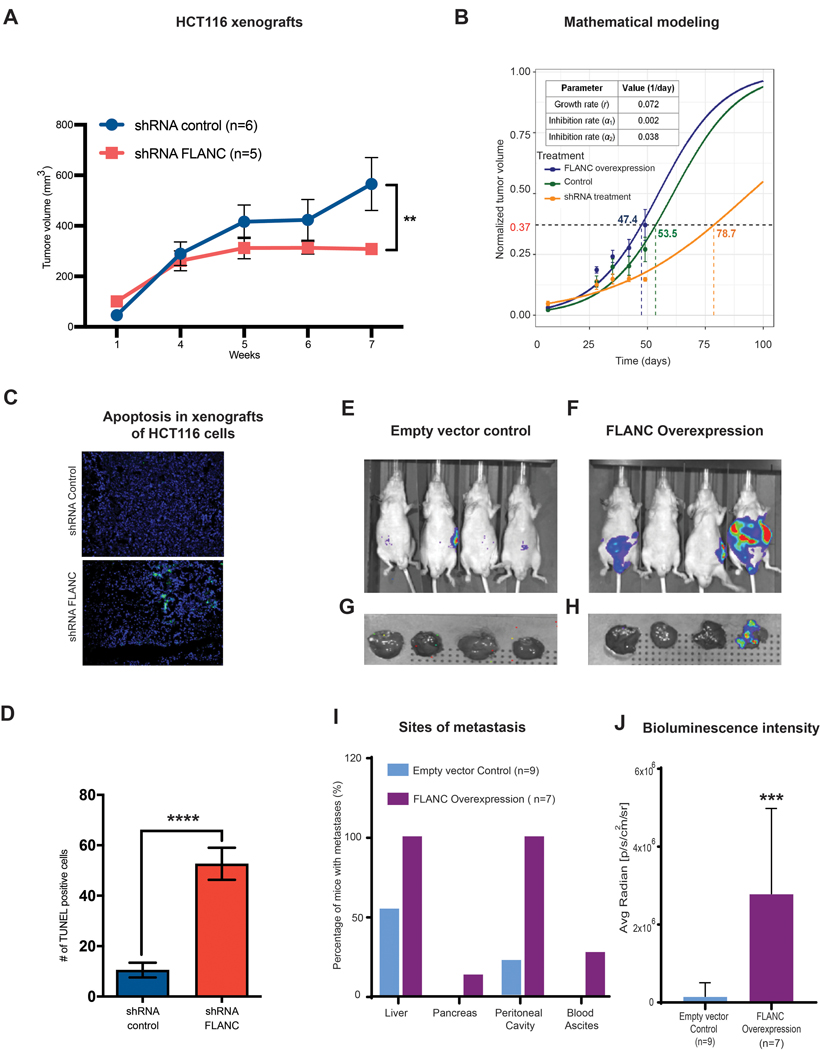
Figure 4. In vivo xenograft colon cancer model for the role of FLANC in tumor growth.

(A) Mice injected with HCT116-shRNA-FLANC cells showed significantly smaller tumors than the shRNA control (**p<0.01). (B) Prediction of tumor volume in different experimental conditions using a mathematical model. (See supplementary materials for modeling details). Tumor growth rate was first estimated (r = 0.072 day−1), and then drug inhibition rates for the shRNA-mediated empty control (α1 = 0.002 day−1) and the shRNA-mediated knock-down of FLANC groups (α2 = 0.038 day−1) were estimated. With these estimated parameters, the model successfully predicts experimentally measured tumor volume change over time. It can be observed that the model predicts the outcome with acceptable accuracy in all three conditions: FLANC overexpression (blue), shRNA empty control (green), and shRNA treatment (orange). (C-D) The TUNEL assay (marks apoptotic bodies) suggests that knock down by shRNA-FLANC is able to induce apoptosis, compared to shRNA control. Colorectal cancer metastases formation was assessed by applying intra-splenic injection of FLANC-expression manipulated HCT116 cells (E-J). Representative chemiluminescent images from whole body nude mice of empty control (E), FLANC overexpression (F), and from removed livers of the empty control (G) and FLANC overexpression cells (H) after approximately seven weeks of intra-splenic injection with empty vector and FLANC overexpressing HCT116 clones are shown. (I) Overall numbers of mice positive by macroscopically exploration of different sites (liver, pancreas, intra-cavity of peritoneum and formation of bloody ascites) (J) The higher number of metastasis correlated with significantly higher intensity of bioluminescence signal in the livers of the group of FLANC overexpressing mice compared with those expressing empty vector control. Data are presented as means ± s.d. (Student’s t-test: **p < 0.01; ***p < 0.001; ****p<0.0001).
