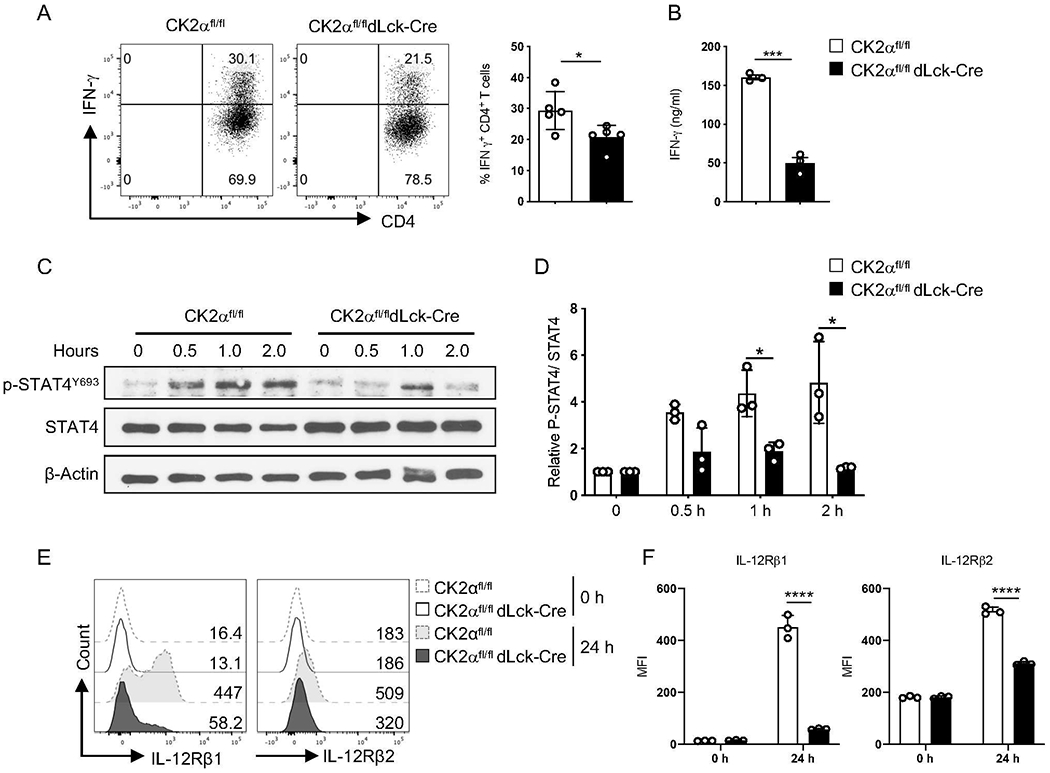
Figure 3. CK2α Controls Th1 Differentiation through the IL-12/STAT4 Pathway.

(A) Naïve CD4+ T-cells from CK2αfl/fl or CK2αfl/fl dLck-Cre mice were polarized under Th1 conditions [anti-CD3 (1 μg/ml), anti-CD28 (1 μg/ml), IL-12 (10 ng/ml) and anti-IL-4 (10 μg/ml)] for 3 days. IFN-γ production by CD4+ T-cells was detected by intracellular staining. Representative flow cytometry profiles of IFN-γ production by CD4+ T-cells is shown (n = 5). (B) IFN-γ in the supernatant was measured by ELISA (n=3). (C) Naïve CD4+ T-cells from CK2αfl/fl mice or CK2αfl/fl dLck-Cre mice were activated with anti-CD3 (1 μg/ml) and anti-CD28 (1 μg/ml) for 24 h, stimulated with IL-12 (10 ng/ml) for the indicated time points, then phosphorylated P-STAT4 Y693 in CD4+ T-cells was detected by immunoblotting. (D) Relative ratio of phosphorylated P-STAT4 Y693 to total STAT4 at the indicated time points is shown (n=3). (E) Naïve CD4+ T-cells from CK2αfl/fl or CK2αfl/fl dLck-Cre mice were activated with anti-CD3 (1 μg/ml) and anti-CD28 (1 μg/ml) for 24 h, and expression levels of IL-12Rβ1 and IL-12Rβ2 detected by flow cytometry. Representative line graphs are shown. (F) Quantitation of MFI of IL-12Rβ1 and IL-12Rβ2 expression is shown. n=3 in each group. Bars represent the mean ± SD. * p<0.05, *** p< 0.001, **** p< 0.0001.
