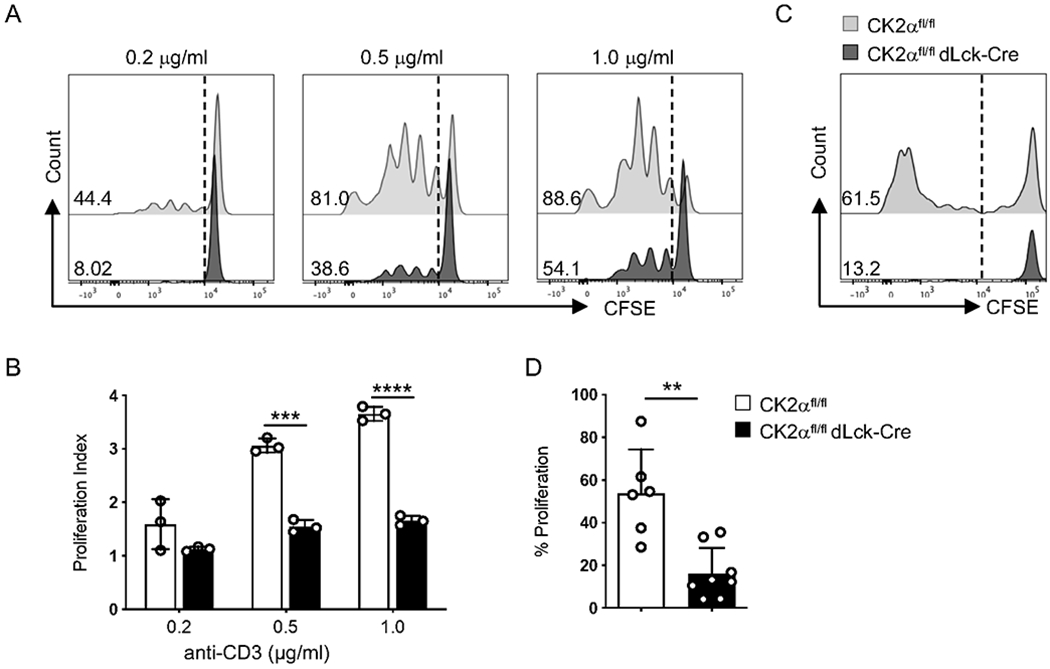
Figure 4. CK2α is Essential for CD4+ T-cell Proliferation In Vitro and In Vivo.

(A) CFSE labeled naïve CD4+ T-cells were activated with the indicated concentrations of anti-CD3 (0.2 μg/ml, 0.5 μg/ml, 1.0 μg/ml) and 1.0 μg/ml of anti-CD28 Abs for 72 h, and proliferation was assessed by CFSE dilution. Representative line graphs are shown. (B) Proliferation index of CD4+ T-cells is shown (n = 3). (C) 1 x 10⁶ CFSE labeled naïve CD4+ T-cells from CK2αfl/fl or CK2αfl/fl dLck-Cre mice were transferred into Rag1−/− mice by i.v. injection. Mice were sacrificed 5 days later, and proliferation of CD4+ T-cells from the spleen was assessed by CFSE dilution. Representative line graphs are shown. (D) Frequencies of cells undergoing proliferation is shown. Data represent pooled results from three independent experiments. CK2αfl/fl, n=6; CK2αfl/fldLck-Cre, n=8. Bars represent the mean ± SD. ** p<0.01, *** p<0.001, **** p<0.0001.
