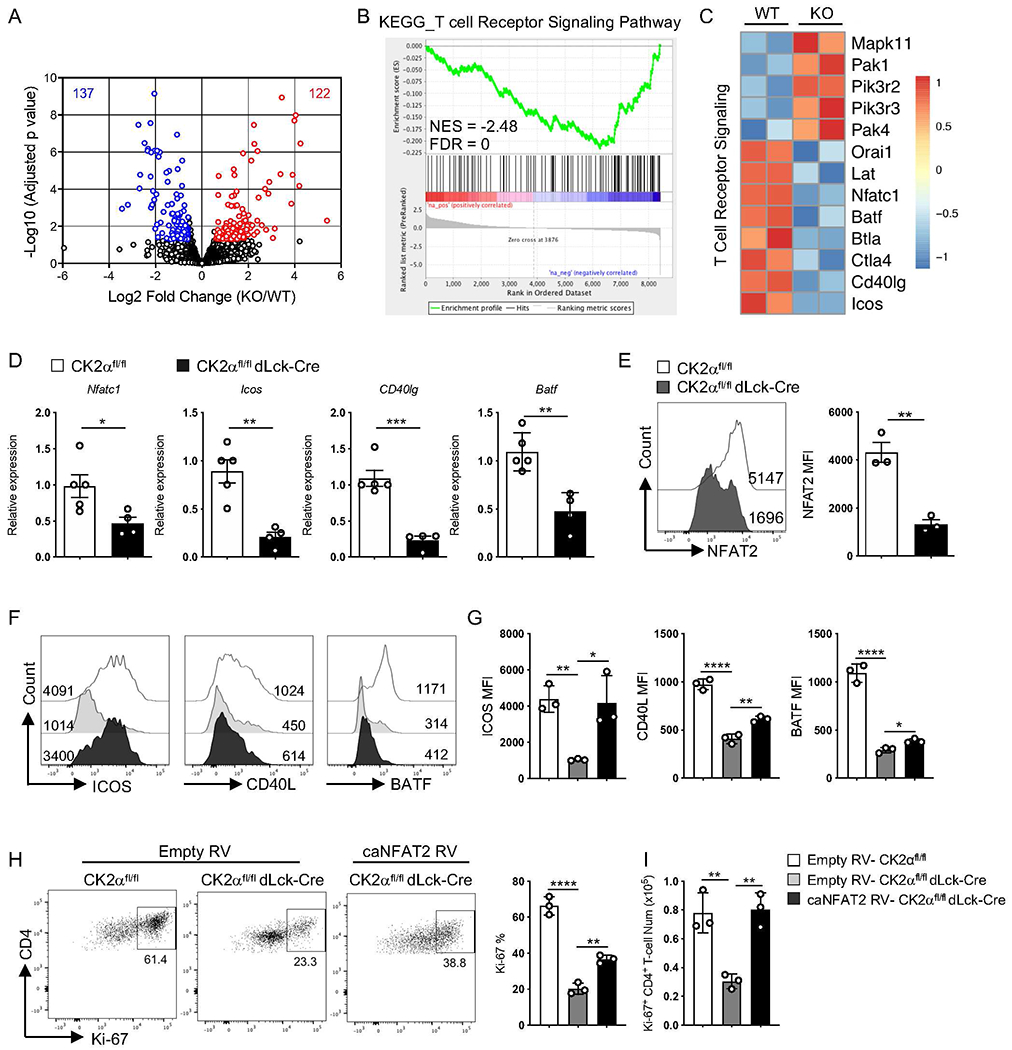
Figure 6. CK2α Controls CD4+ T-cell Responses by Regulating Expression of NFAT2.

RNA sequencing of CK2αfl/fl CD4+ T-cells (WT) and CK2αfl/fl dLck-Cre CD4+ T-cells (KO) from the colon at 6 weeks after colitis induction was performed (three to five mice were combined per experiment, two experiments in each group). (A) Summary of genes differentially regulated by CK2α using the following cutoffs are shown: p < 0.05, fold change >1.5. (B) GSEA plot shows enrichment of RNA sequencing data compared with KEGG pathway dataset. (C) Heat map shows TCR signaling relative gene expression. (D) Selected gene expression was validated in CD4+ T-cells from colitis Rag1−/− mice by qRT-PCR. CK2αfl/fl, n=5; CK2αfl/fldLck-Cre, n=4. (E) Naive CD4+ T-cells from CK2αfl/fl and CK2αfl/fl dLck-Cre mice were activated with 0.5 μg/ml of anti-CD3 and 1.0 μg/ml of anti-CD28 Abs for 24 h, and expression of NFAT2 was detected by flow cytometry. Representative line graphs and quantitation are shown. n=3 in each group. (F) Naïve CD4+ T-cells from CK2αfl/fl and CK2αfl/fl dLck-Cre mice were activated and transduced with caNFAT2 or empty control vector. GFP+ transduced cells were sorted and stimulated with 0.1 μg/ml of anti-CD3 and 1.0 μg/ml of anti-CD28 Abs for 48 h, and expression of ICOS, CD40L and BATF was detected by flow cytometry. Representative line graphs are shown. (G) Quantitation of relative MFI of ICOS, CD40L and BATF is shown. n=3 in each group. (H) GFP+ cells were sorted and stimulated with 0.1 μg/ml of anti-CD3 and 1.0 μg/ml of anti-CD28 Abs for 48 h, and proliferating cells detected by Ki-67 staining. Representative line graphs and quantitation are shown. (I) Quantitation of absolute number of Ki-67+ CD4+ T-cells is shown. n=3 in each group. Bars represent the mean ± SD. * p<0.05, ** p<0.01, *** p<0.001, **** p<0.0001.
