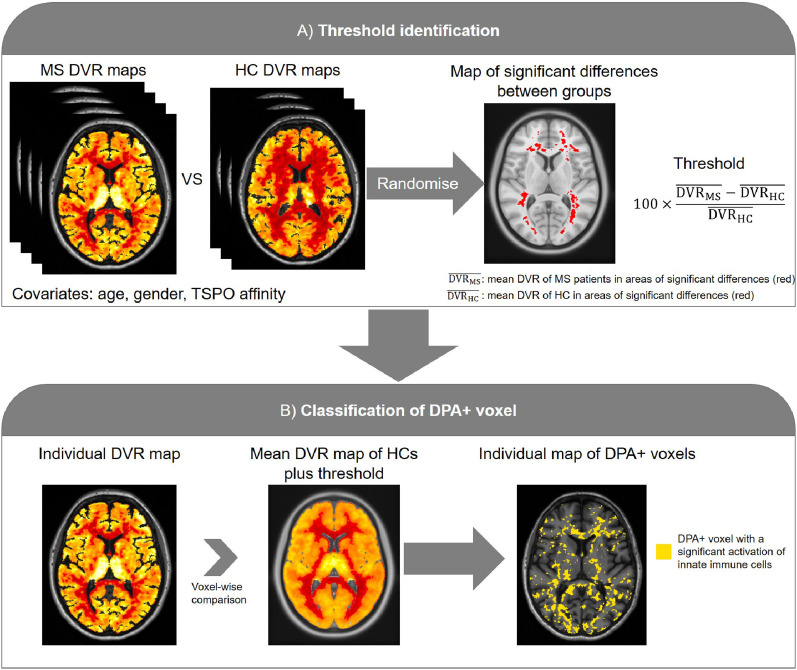
FIGURE 1.
Flowchart of image analysis pipeline applied to generate individual maps of innate immune cell activation, based on 18F-DPA-714 PET. (A) Definition of threshold to identify innate immune cell activation. Regions of significant group differences between DVR maps of patients with MS and HCs were identified through voxelwise nonparametric permutation-based t test. From these regions of significant difference, mean DVR in patients and HCs were extracted and used to calculate relative percentage threshold. (B) Classification of DPA+ voxels. We classified as DPA+ all voxels whose DVR was above the following value: the mean DVR of the voxels localized at the same MNI coordinates in HC enhanced by the previously calculated threshold.

