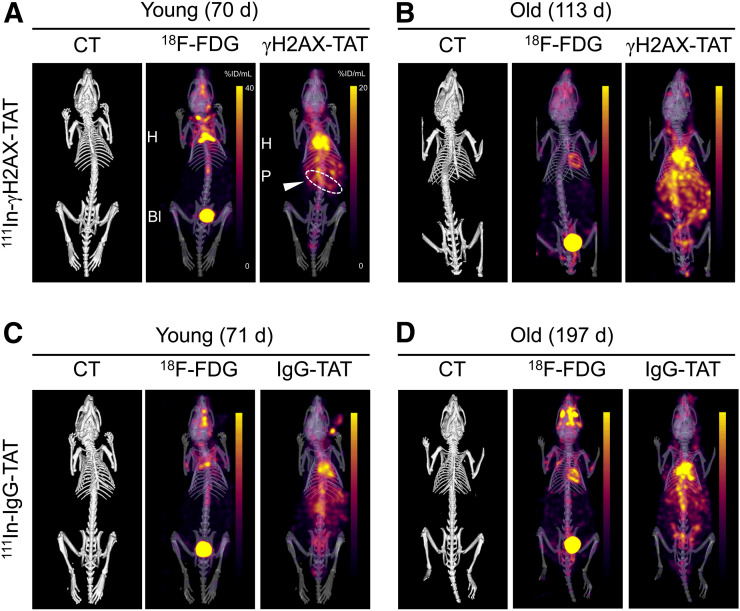
FIGURE 2.
Concurrently acquired CT, 18F-FDG, and 111In-anti-γH2AX-TAT (A and B) or 111In-IgG-TAT (C and D) images of KPC mice. Representative examples of younger and older animals are presented. Images are coronal maximum-intensity projections superimposed on 3-dimensional rendering of CT images. Coronal images of same mice are presented in Supplemental Figure 3.

