
Figure 1. Liver NK Cell Populations Have Distinct Kinetic Responses to MCMV Infection.
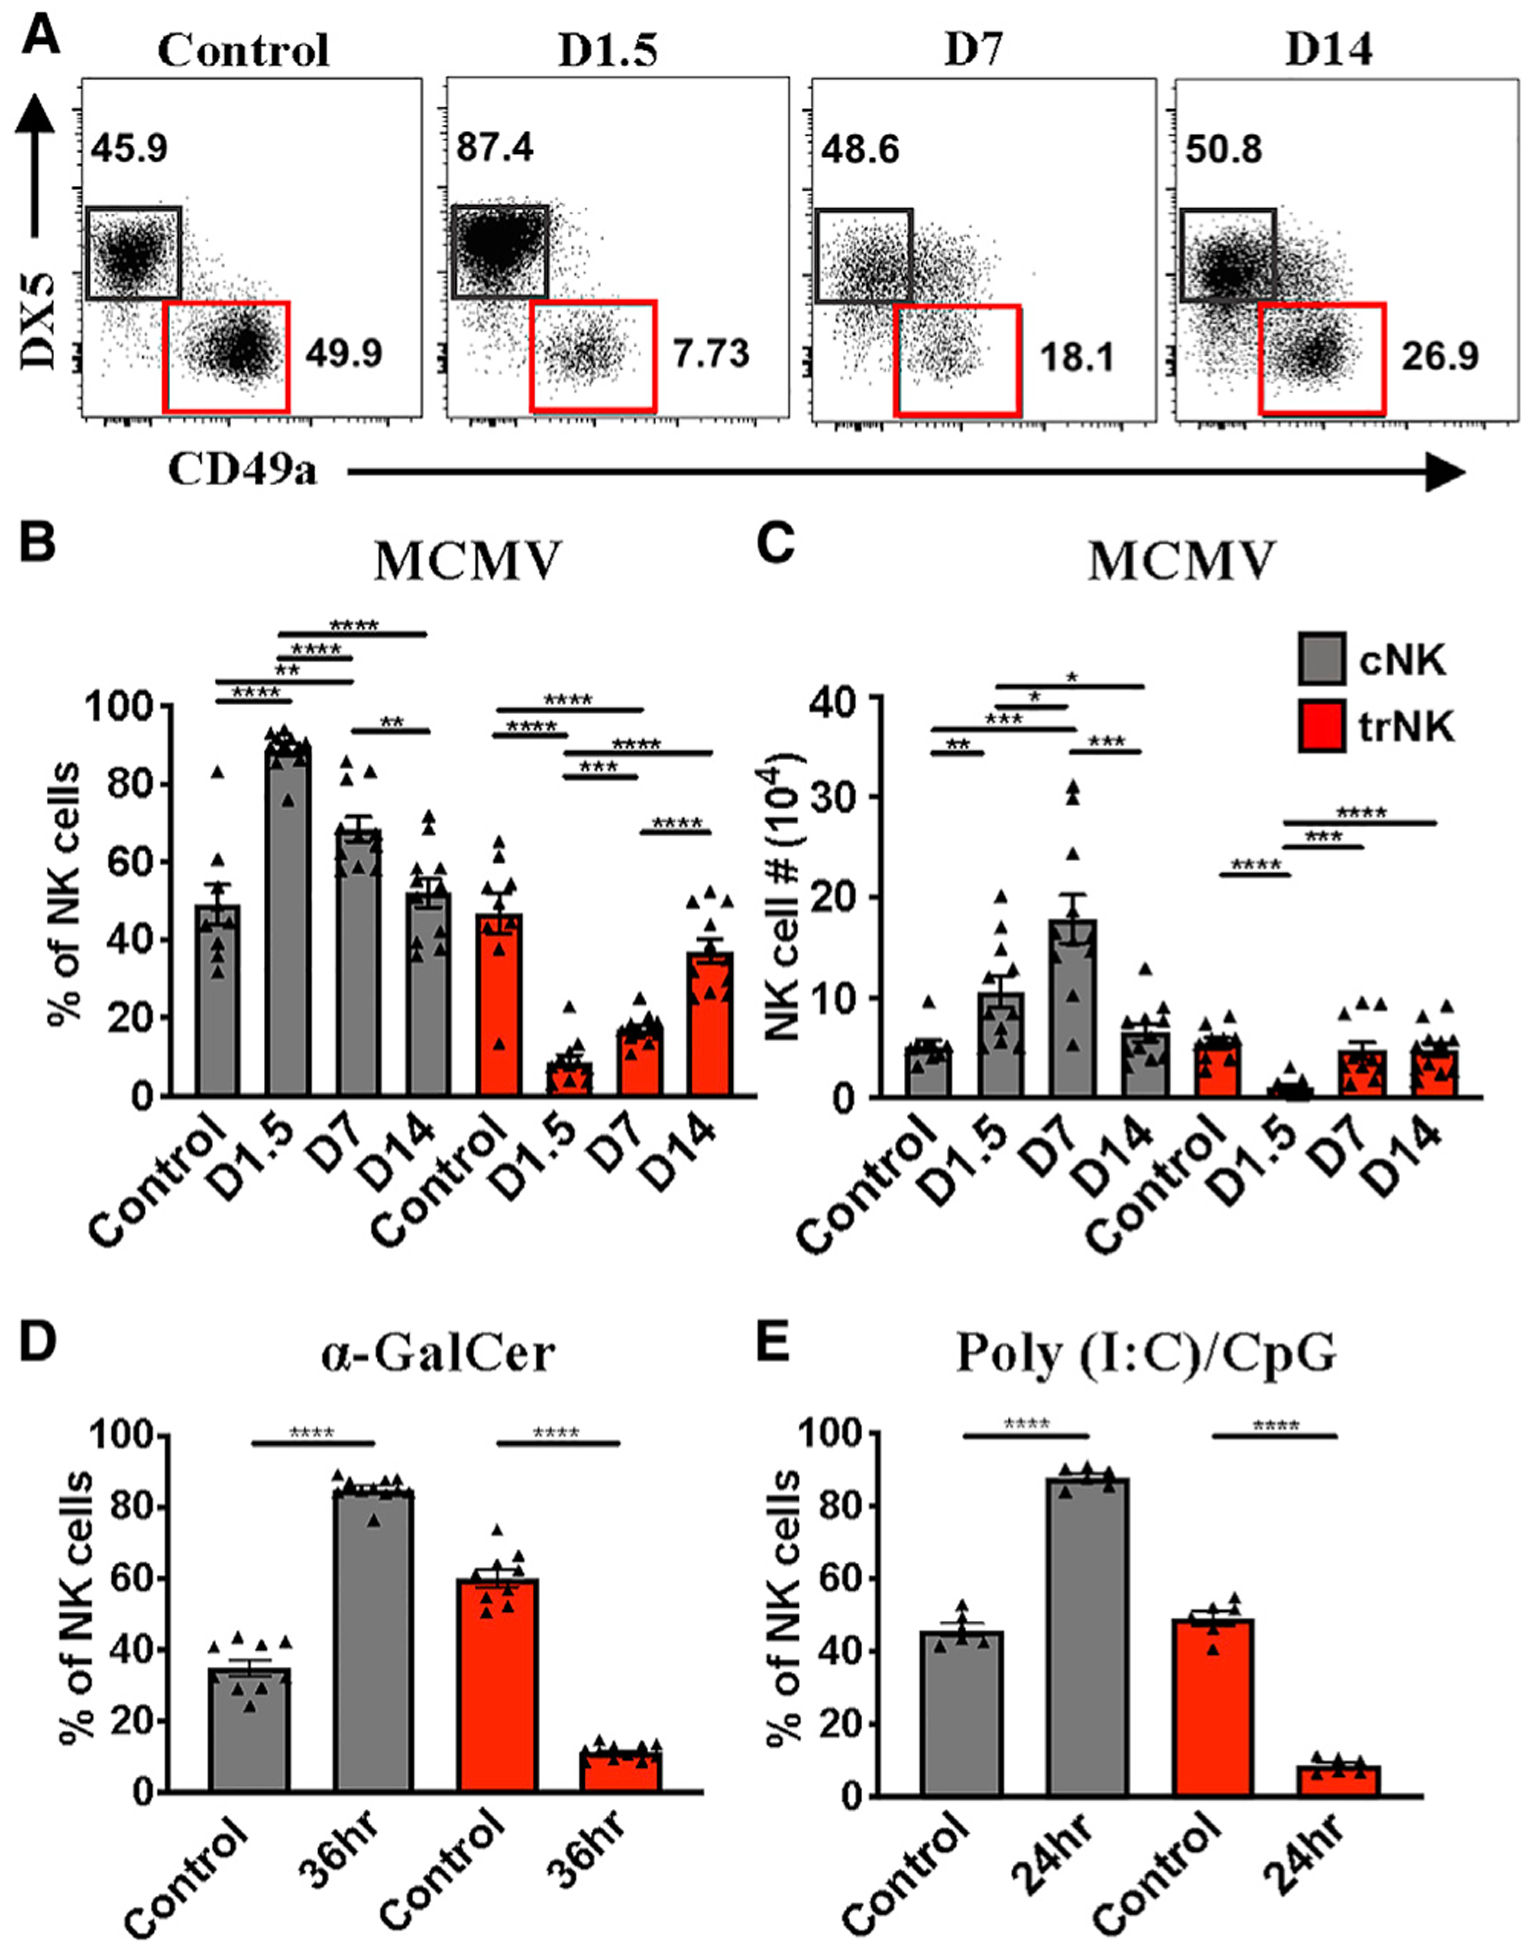
(A) Representative staining of liver cNK (gray) and trNK (red) cells at the indicated time points post-MCMV infection in C57BL/6 mice. Samples are first gated on TCRβ−CD3−NK1.1+ cells.
(B and C) Frequency (B) and absolute numbers (C) of liver cNK and trNK cell populations 0, 1.5, 7, or 14 days post-infection (n = 9–11).
(D) Frequency of liver cNK and trNK populations 36 h after α-GalCer treatment (n = 9–10).
(E) Frequency of liver cNK and trNK cell populations 24 h after poly(I:C)/CpG treatment (n = 6).
Data are representative of (A) or pooled from 2–3 experiments (B–E); error bars indicate SEM. *p < 0.05, **p < 0.01,***p < 0.001, and ****p < 0.0001.