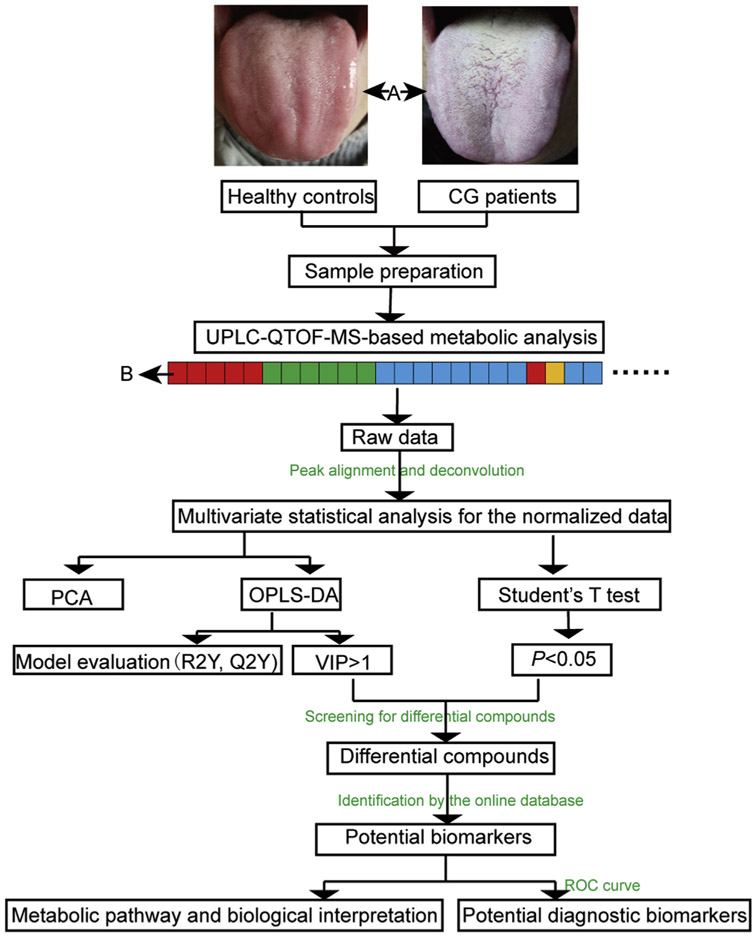
Fig. 1.
Flowchart of UPLC-QTOF-MS-based tongue coating metabolomics analysis approach for the CG group and HC group. The details of the sample running sequence is shown in “B”: the red, green, blue and yellow color represent the blank solution, the QC1 samples, the real samples and the QC2 samples, respectively.

