Fig. 1.
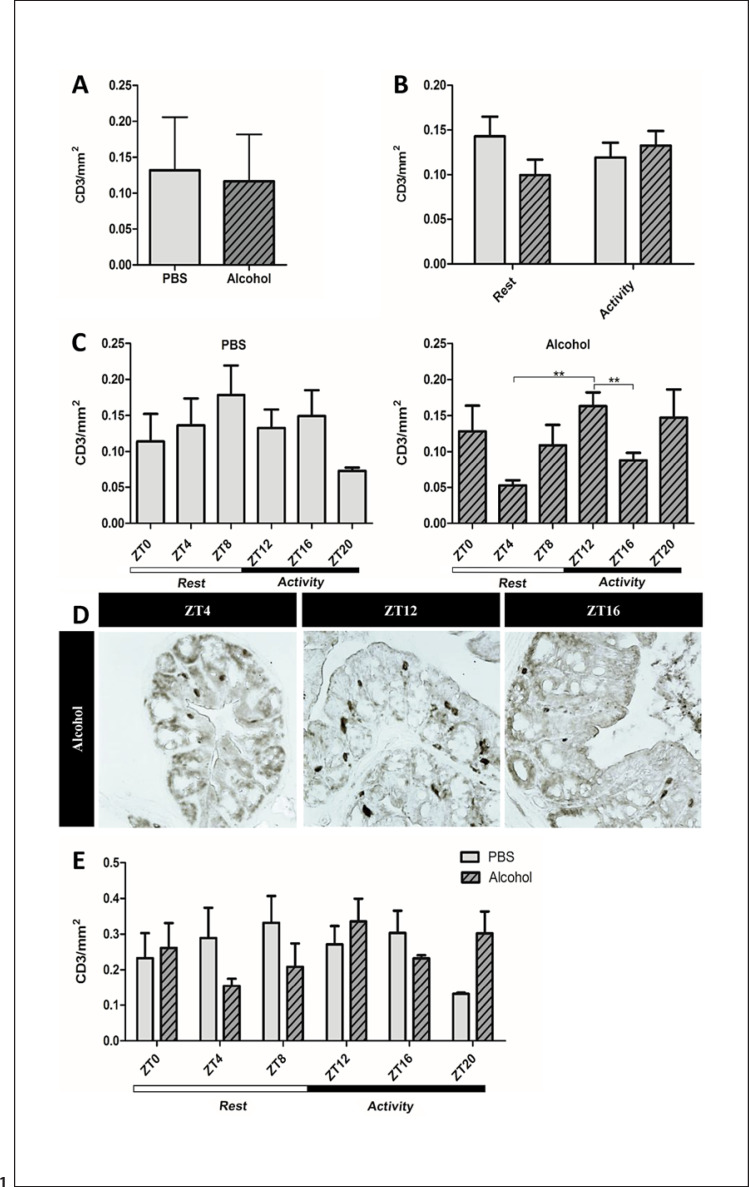
CD3+ T cells in the proximal colon. Proximal colon samples of mice treated with PBS or alcohol binge at the same time point each day stained for CD3, the T cell receptor, using IP staining. a Mean CD3+ T cells counts of all ZTs collected over 24 h (n = 30) unpaired Student's t test, p = ns. b Mean CD3+ T cells following treatment during active/rest phases (n = 15) two-way ANOVA and a priori post hoc comparison via Student's t test, p = ns. c Mean CD3+ T cells at each ZT. PBS treatment (left), alcohol treatment (right) (n = 5) analyzed via one-way ANOVA, p = ns; a priori post hoc comparison via unpaired Student's t test, ** p < 0.008. d Representative photomicrographs depicting CD3+ T cells at ZT4, ZT12, and ZT16. e Mean CD3+ T cells counts at separate ZTs for both PBS and alcohol groups (n = 5) analyzed via two-way ANOVA and a priori post hoc comparison via unpaired Student's t test, p = ns. ZT, Zeitgeber time.

