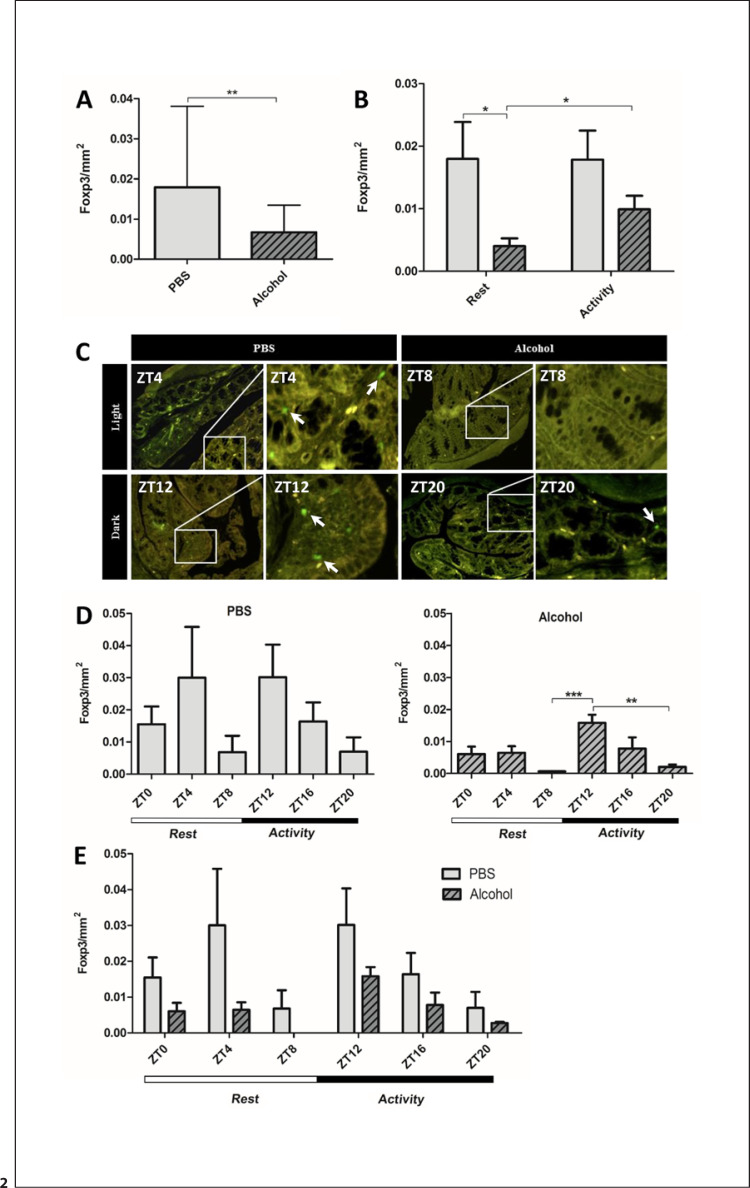
Fig. 2.
Foxp3+ Tregs in the proximal colon. Proximal colon samples of mice treated with PBS or alcohol binge at the same time point each day stained for Foxp3 using IF staining. a Mean Foxp3+ cell counts at all ZTs over 24 h (n = 30), unpaired Student's t test, ** p < 0.01. b Mean Foxp3+ Tregs following treatment during active/rest phases (n = 15) two-way ANOVA, alcohol binge p < 0.01, binge time p = ns, interaction p = ns; a priori post hoc comparison via Student's t test, * p < 0.03. c Representative photomicrographs depicting Foxp3+ Tregs during active/rest phases. d Mean Foxp3+ Tregs at each ZT (n = 5). Left: PBS; one-way ANOVA, p = ns; a priori post hoc comparison via unpaired Student's t test, p = ns. Right: alcohol; one-way ANOVA, p < 0.001; a priori post hoc comparison via unpaired Student's t test, ** p < 0.01, *** p < 0.001. e Mean Foxp3+ Tregs cell count at separate ZTs for both PBS and alcohol groups (n = 5); two-way ANOVA, alcohol binge p < 0.008, binge time p < 0.05, interaction p = ns; a priori post hoc comparison via unpaired Student's t test, p = ns.

