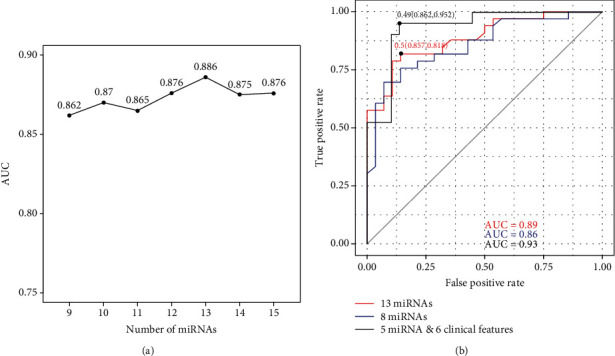
Figure 5.

The performance of miRNA-based classification models for KD diagnosis. (a) Area under the ROC curves using different combinations of miRNA candidates. Classification models were built using 87 samples and were tested using 61 independent samples. (b) Area under the ROC curves using the combination of 13 miRNAs, 8 differentially expressed miRNAs, and miRNA & clinical features.
