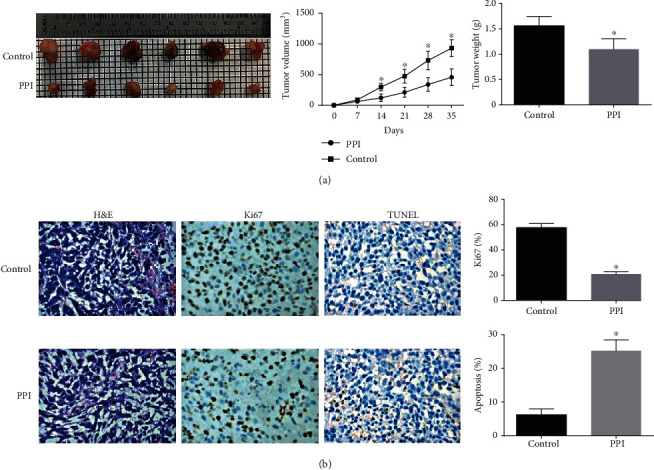
Figure 7.

Images of excised tumors from mice at 35 days. (a) The comparison of tumor weight and volume between the control group and the Polyphyllin I group. (b) Representative images of H&E staining and immunohistochemical staining of Ki67 and TUNEL in tumor sections of the two groups. ∗P < 0.05 in comparison with the control group.
