
Extended Data Fig. 3. Abundance of transposons in pi6em1/em1 and pi6em2/em2 germ cells.
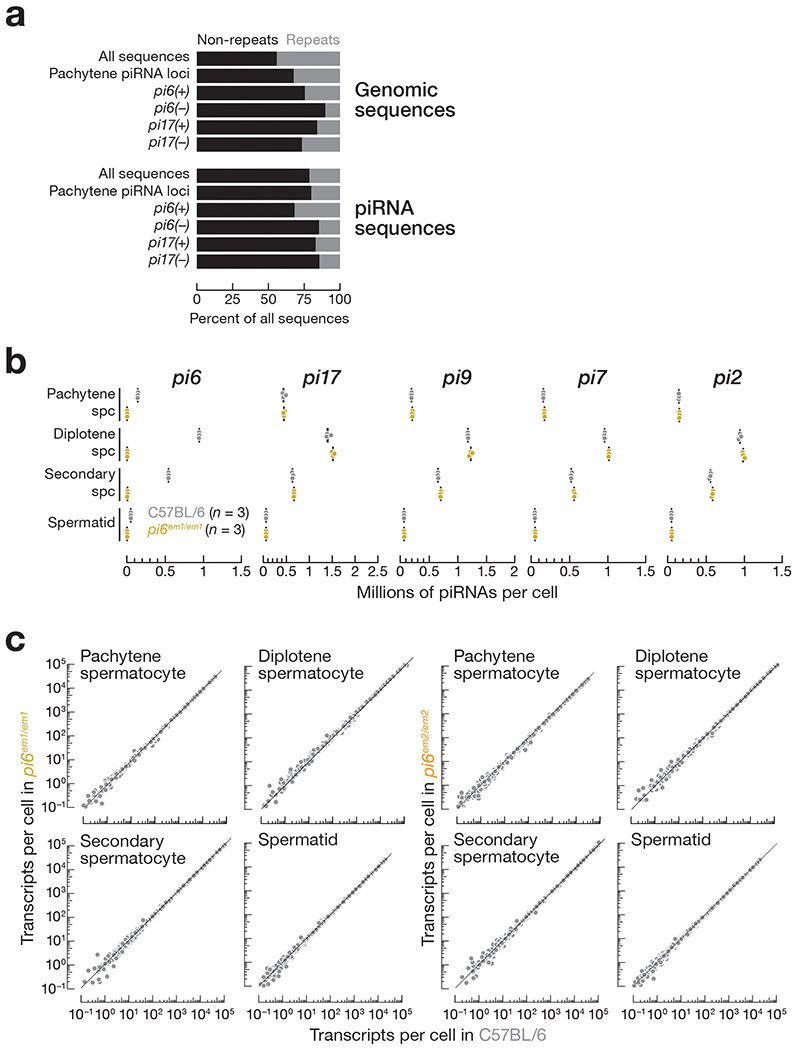
(a) Proportions of the whole genome or piRNA sequences composed of repetitive sequences. (b) Abundance of mature piRNAs from the top five major pachytene piRNA-producing loci in indicated cell types measured by small RNA-seq. Each dot represents the abundance of uniquemapping reads in one C57BL/6 (n = 3) or pi6em1/em1 (n = 3) male. Vertical black lines denote median; boxes report 75th and 25th percentiles; whiskers indicate the maximal and minimal values. (c) Abundance of transposon-derived RNAs in mouse germ cells. Each dot represents the mean of four (wild-type and pi6em1/em1) or three (pi6em2/em2) biologically independent RNA-seq experiments. Gray dots indicate change in abundance <2-fold and/or FDR >0.05 determined by DESeq2 (see also Methods).