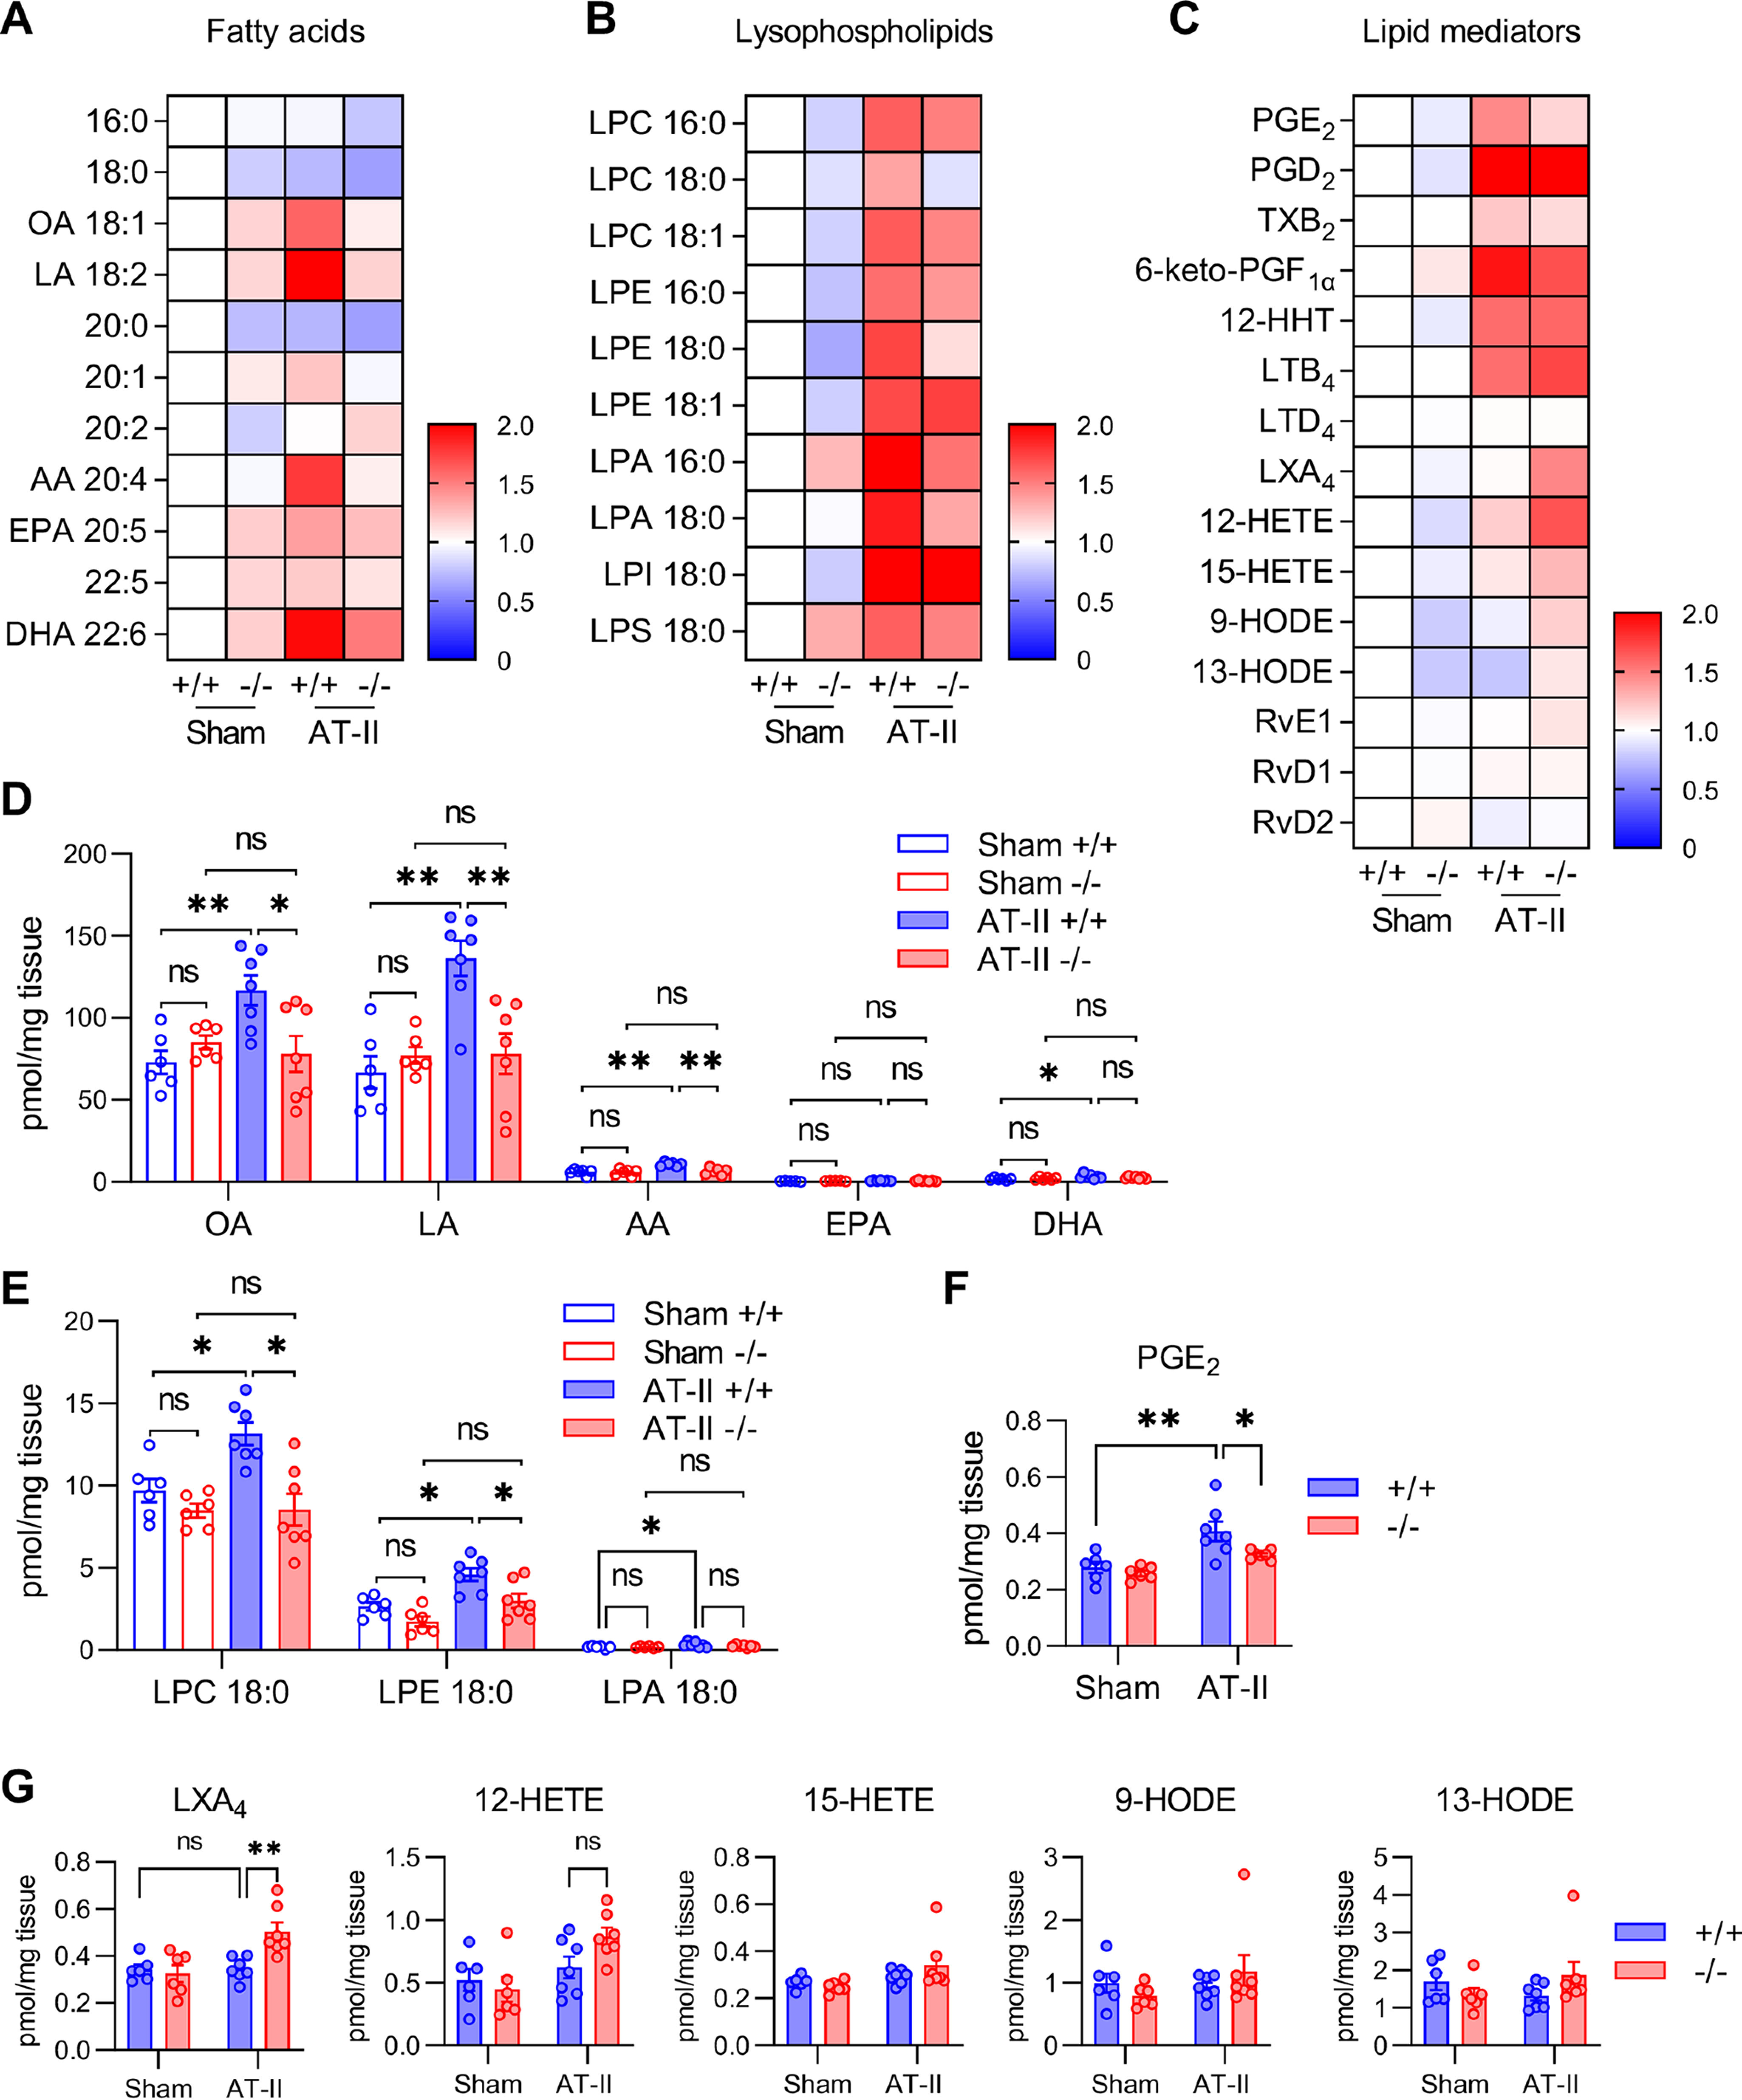
Figure 5.

Altered lipid profiles in Pla2g5−/− mice after AT-II infusion. A–C, heat map representation of LC-ESI-MS/MS profiling of fatty acids (A), lysophospholipids (B), and lipid mediators (C) in the aortas of Pla2g5+/+ and Pla2g5−/− mice with or without AT-II infusion for 12 h. -Fold changes relative to sham Pla2g5+/+ are represented by color (n = 6–7). D–G, LC-ESI-MS/MS of unsaturated fatty acids (D), lysophospholipids (E), and HUFA-derived lipid mediators (F and G) presented as pmol/mg of tissue dry weight (n = 6–7). *, p < 0.05; **, p <0.01; ns, not significant by two-way ANOVA followed by Tukey's multiple-comparison test. Data are presented as mean ± S.E. (error bars) of the indicated number (n) of biological replicates.
