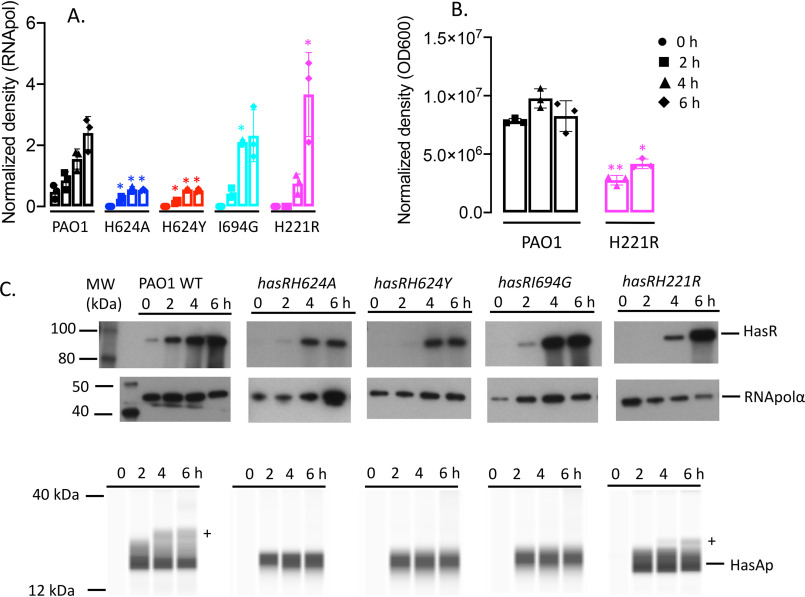
Figure 10.
Relative HasR and HasAp protein levels for the hasR allelic strains under holo-HasAp-supplemented conditions. A, HasR protein at 0, 2, 4, and 6 h following growth in M9 minimal media supplemented with 1 μm holo-HasAp. B, as in panel A but for HasAp. Normalized density (n = 3) was performed on Western blots for three separate biological replicates. Error bars represent the standard deviations from three independent experiments performed in triplicate. The indicated p values for HasR were normalized to the RNApolα subunit as a loading control and to the OD600 for HasAp. Indicated p values are for the hasR allelic strains normalized to PAO1 WT at the same time point: *, p < 0.05; **, p < 0.005. C, representative Western blotting of PAO1 WT and the hasR allelic strains for HasR and HasAp. HasAp digital images were generated by capillary Western blot analysis on an automated Wes system. Endogenously produced HasAp is denoted by a plus sign. The lower band represents exogenously added truncated holo-HasAp.

