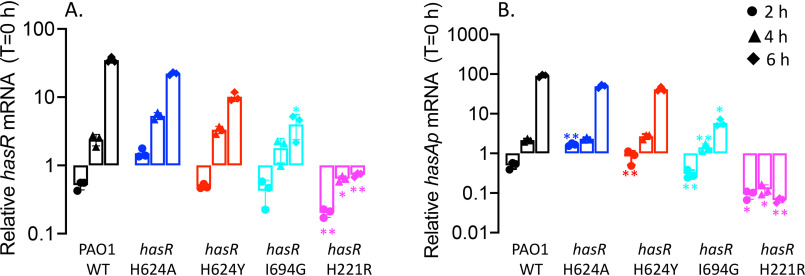
Figure 7.
Relative hasR and hasAp mRNA levels for the hasR allelic strains under heme-supplemented conditions. A, hasR relative mRNA levels. B, hasAp relative mRNA levels. mRNA isolated at 0, 2, 4, and 6 h following growth in M9 supplemented with 1 μm heme. mRNA values represent the mean from three biological experiments, each performed in triplicate and normalized to PAO1 WT at the same time point. Error bars represent the standard deviations from three independent experiments performed in triplicate. The indicated p values were normalized to mRNA levels of PAO1 WT at the same time point: *, p < 0.05; **, p < 0.005.

