Figure 2.

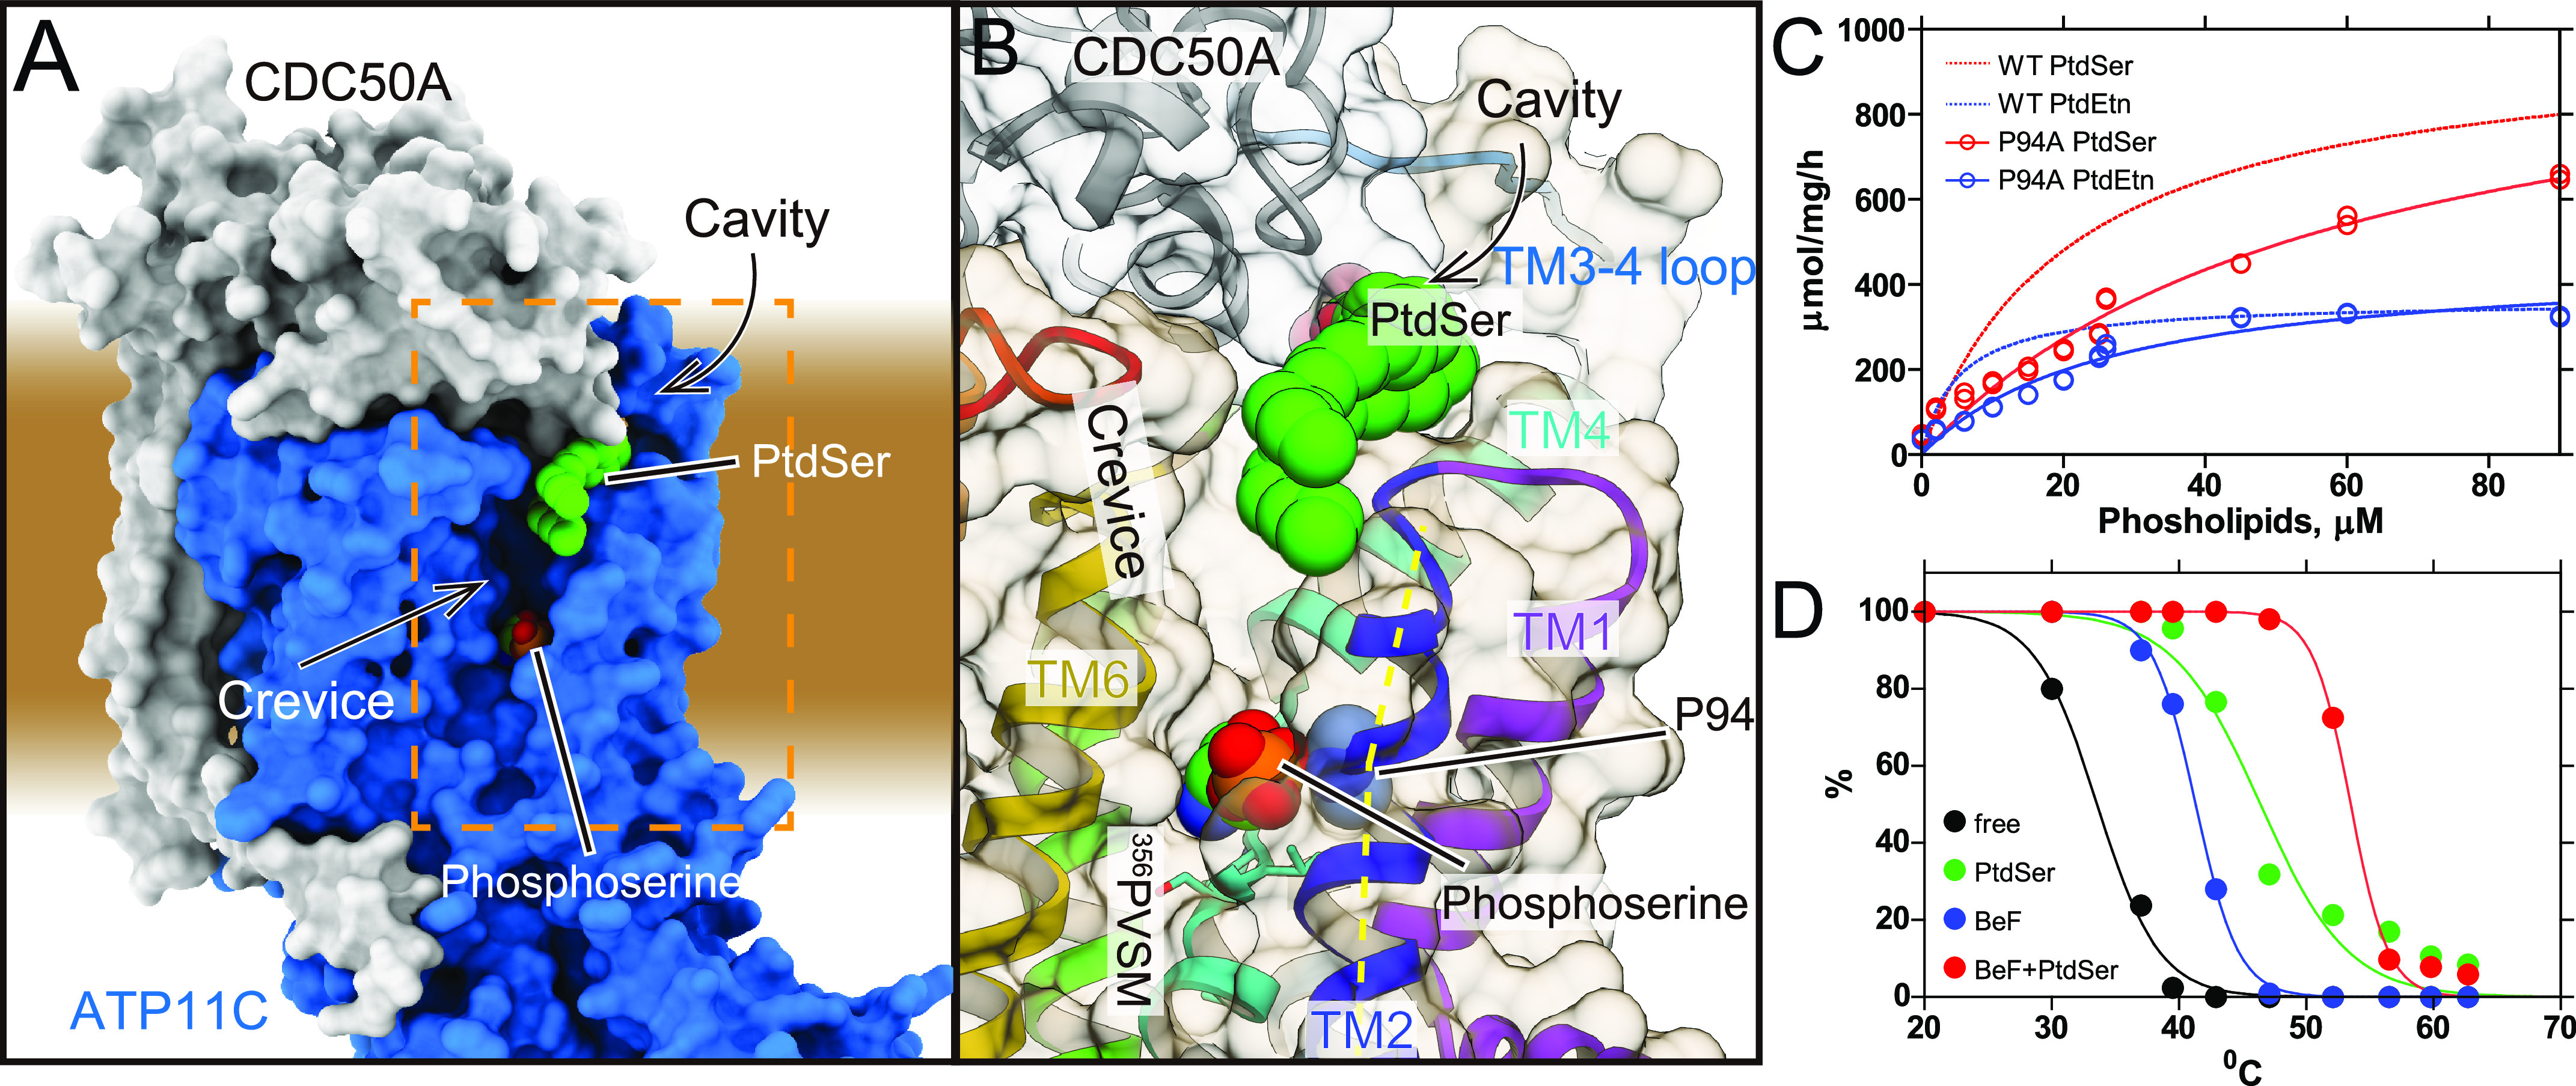
The crevice in the TM region. A, surface representation of the ATP11C—CDC50A complex shows the crevice in the TM region. Green spheres with CPK coloring represent phosphoserine at the occlusion site in the crevice, and PtdSer bound to the exoplasmic cavity. Surfaces of the atomic model of ATP11C and CDC50A are shown in blue and gray, respectively. B, close-up view of the membrane crevice indicated as a dotted box in A. The crevice is mostly composed of TM2, TM4, and TM6. Pro-94 makes a kink at the exoplasmic side of TM2 (yellow dotted lines), which exposes the unwound region of TM4 (PVSM, shown in sticks) to the lipid bilayer phase. C, PtdSer- or PtdEtn-dependent ATPase activities of WT (same as in Fig. 1) and P94A mutant as indicated in the figure. D, thermal stabilities of purified ATP11C—CDC50A complex determined by FSEC (see “Experimental procedures”). Peak values in the FSEC analysis were plotted as a function of treatment temperature in the absence (free) or presence of indicated substrates.
