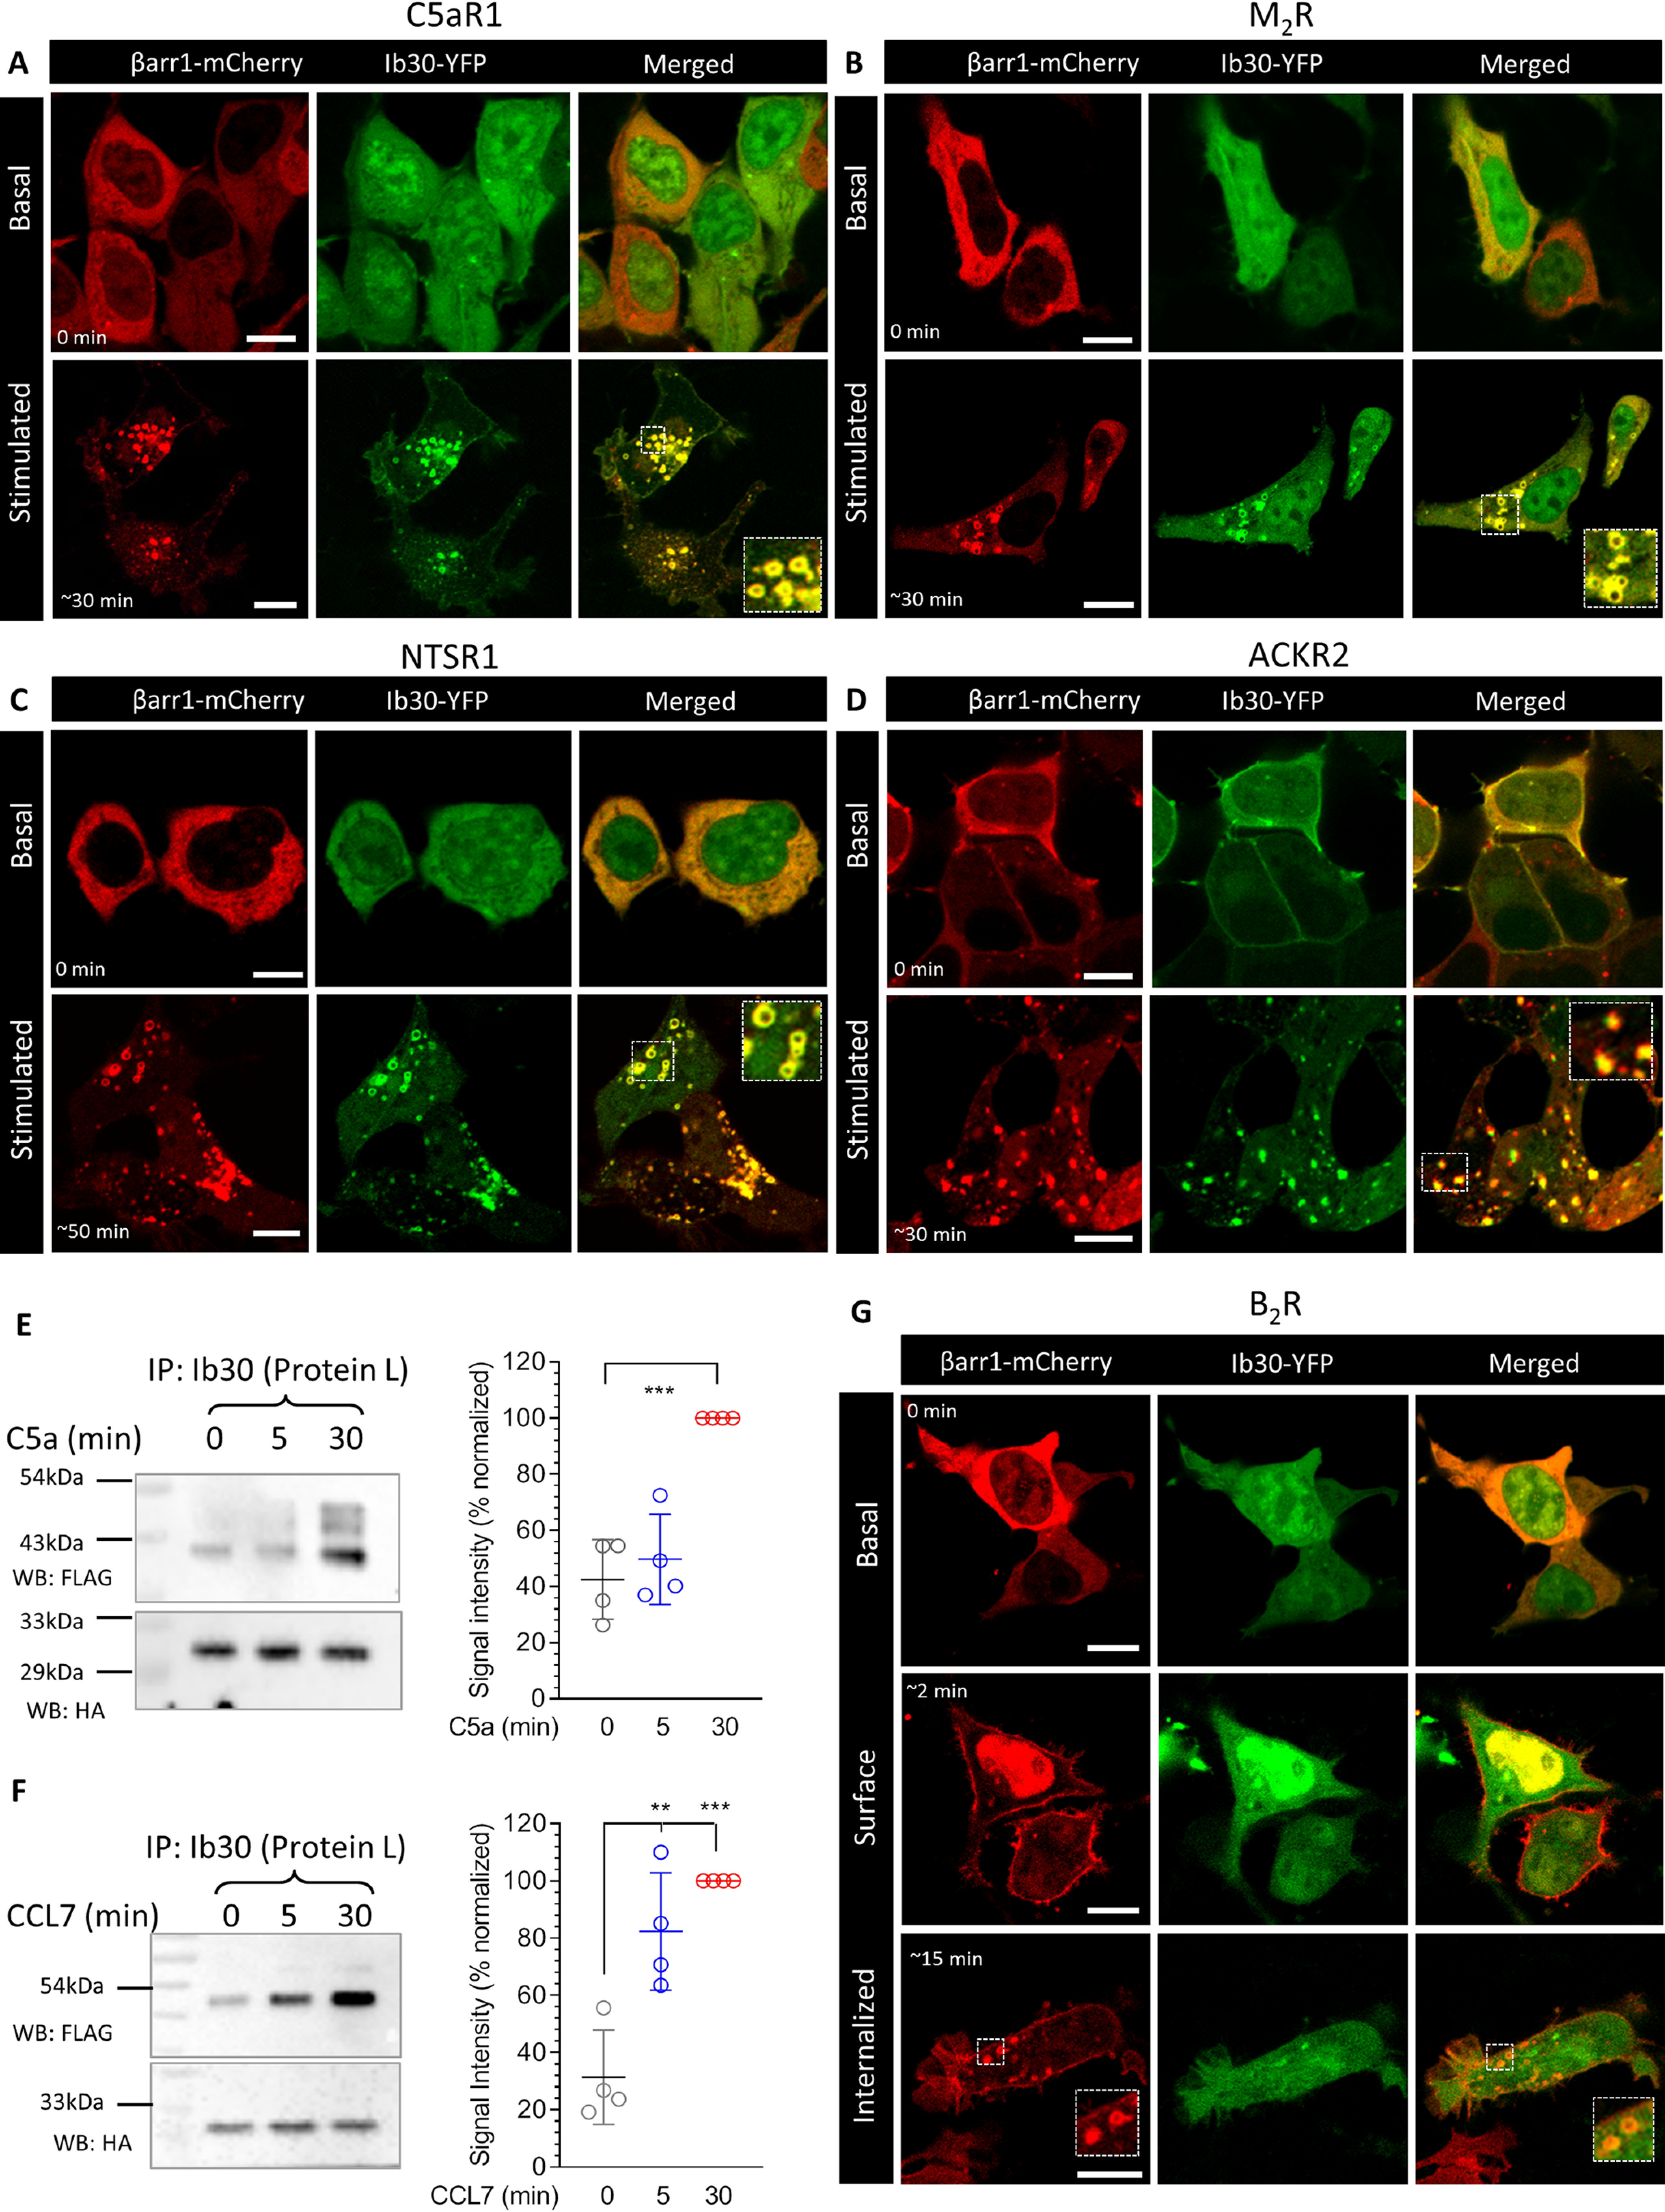
Figure 10.

Ib30 reports agonist-induced trafficking of βarr1 for several unmodified GPCRs. A–D, HEK-293 cells expressing the indicated receptor, βarr1–mCherry and Ib30–YFP were stimulated with saturating concentration of respective agonists (100 nm C5a, 20 μm carbachol, 100 nm NTS1, and 100 nm CCL7, respectively), and the localization of βarr1 and Ib30 was visualized using confocal microscopy at the indicated time points. PCCs were measured to assess the co-localization of βarr1 and Ib30 using JACoP plugin in ImageJ, and the values for the unstimulated and stimulated conditions, respectively, are presented here. The following values were obtained: for C5aR1, 0.27 ± 0.03 from 20 cells and 0.75 ± 0.03 from 25 cells with five independent experiments; for M2R, 0.30 ± 0.04 from 8 cells and 0.85 ± 0.02 from 25 cells with four independent experiments; for NTSR1, 0.24 ± 0.04 from 15 cells and 0.87 ± 0.01 from 16 cells with three independent experiments; and for ACKR2, 0.88 ± 0.02 from 9 cells and 0.81 ± 0.01 from 29 cells with three independent experiments. Scale bar, 10 μm. For ACKR2, we observed significant membrane localization of βarr1 and Ib30, even before agonist treatment, which results into higher PCC values for unstimulated condition. E and F, HEK-293 cells expressing the C5aR1 and ACKR2, respectively, together with βarr1 and Ib30 were stimulated with either respective agonists (100 nm) for the indicated time points followed by co-IP using protein L–agarose beads. Subsequently, the proteins were visualized by Western blotting (WB) using anti-FLAG M2 antibody and anti-HA antibody. The right panels show densitometry-based quantification of four independent experiments normalized with signal at 30 min (treated as 100%) and analyzed using one-way ANOVA. **, p < 0.01; ***, p < 0.001. G, Ib30 does not follow agonist-induced translocation of βarr1 for the B2R as assessed by confocal microscopy on HEK-293 cells expressing B2R, βarr1–mCherry, and Ib30–YFP and stimulated with 100 nm bradykinin. The PCCs in the upper, middle, and lower panels were 0.33 ± 0.03 from 15 cells, 0.34 ± 0.03 from 20 cells, and 0.34 ± 0.04 from 16 cells, respectively, based on five independent experiments. Scale bar, 10 μm.
