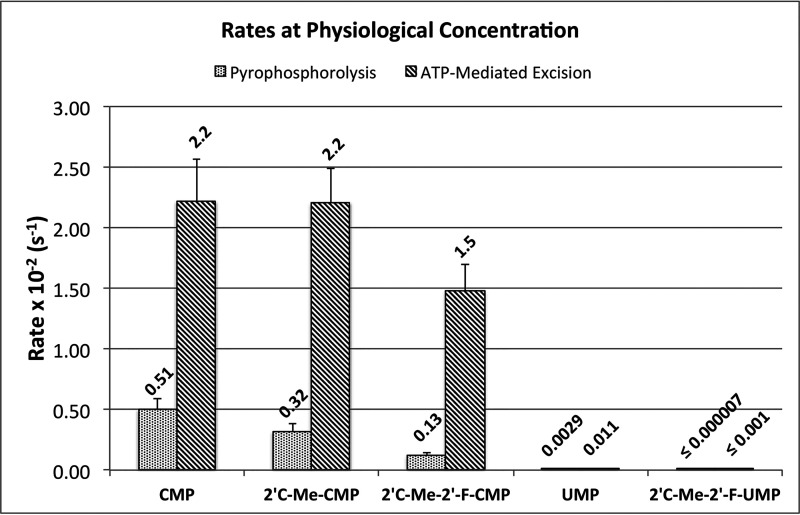
Figure 11.
Comparison of rates of excision reactions under physiological conditions. The chart compares the rates of pyrophosphorolysis and ATP-mediated excision for CMP, 2′-modified CMP analogs, and UMP at physiological concentrations. Rates were calculated using 3.5 μm for pyrophosphate and 3 mm for ATP. The numbers above the bar show the calculated rates × 10−2 s−1. Error bars, S.E.

