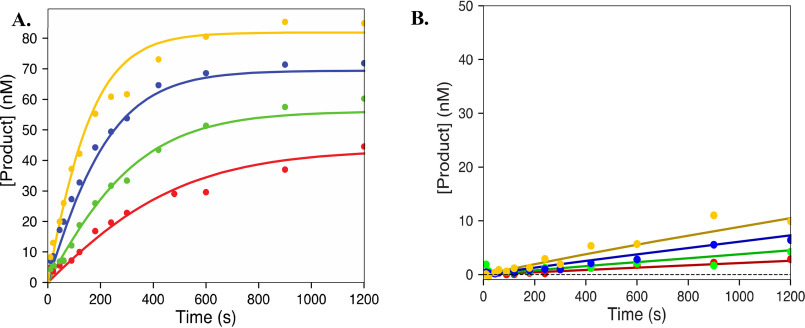
Figure 6.
Excision of UTP. The plots show UMP excision by pyrophosphorolysis (250, 500, 1000, and 2000 μm) (A) and ATP-mediated excision (1, 2, 4, and 8 mm) (B). The results were fit to Schemes 2 and 3, respectively, using KinTek Explorer. The solid lines represent the best fit generated during fitting. Results are summarized in Table 2.

