
Figure 8.
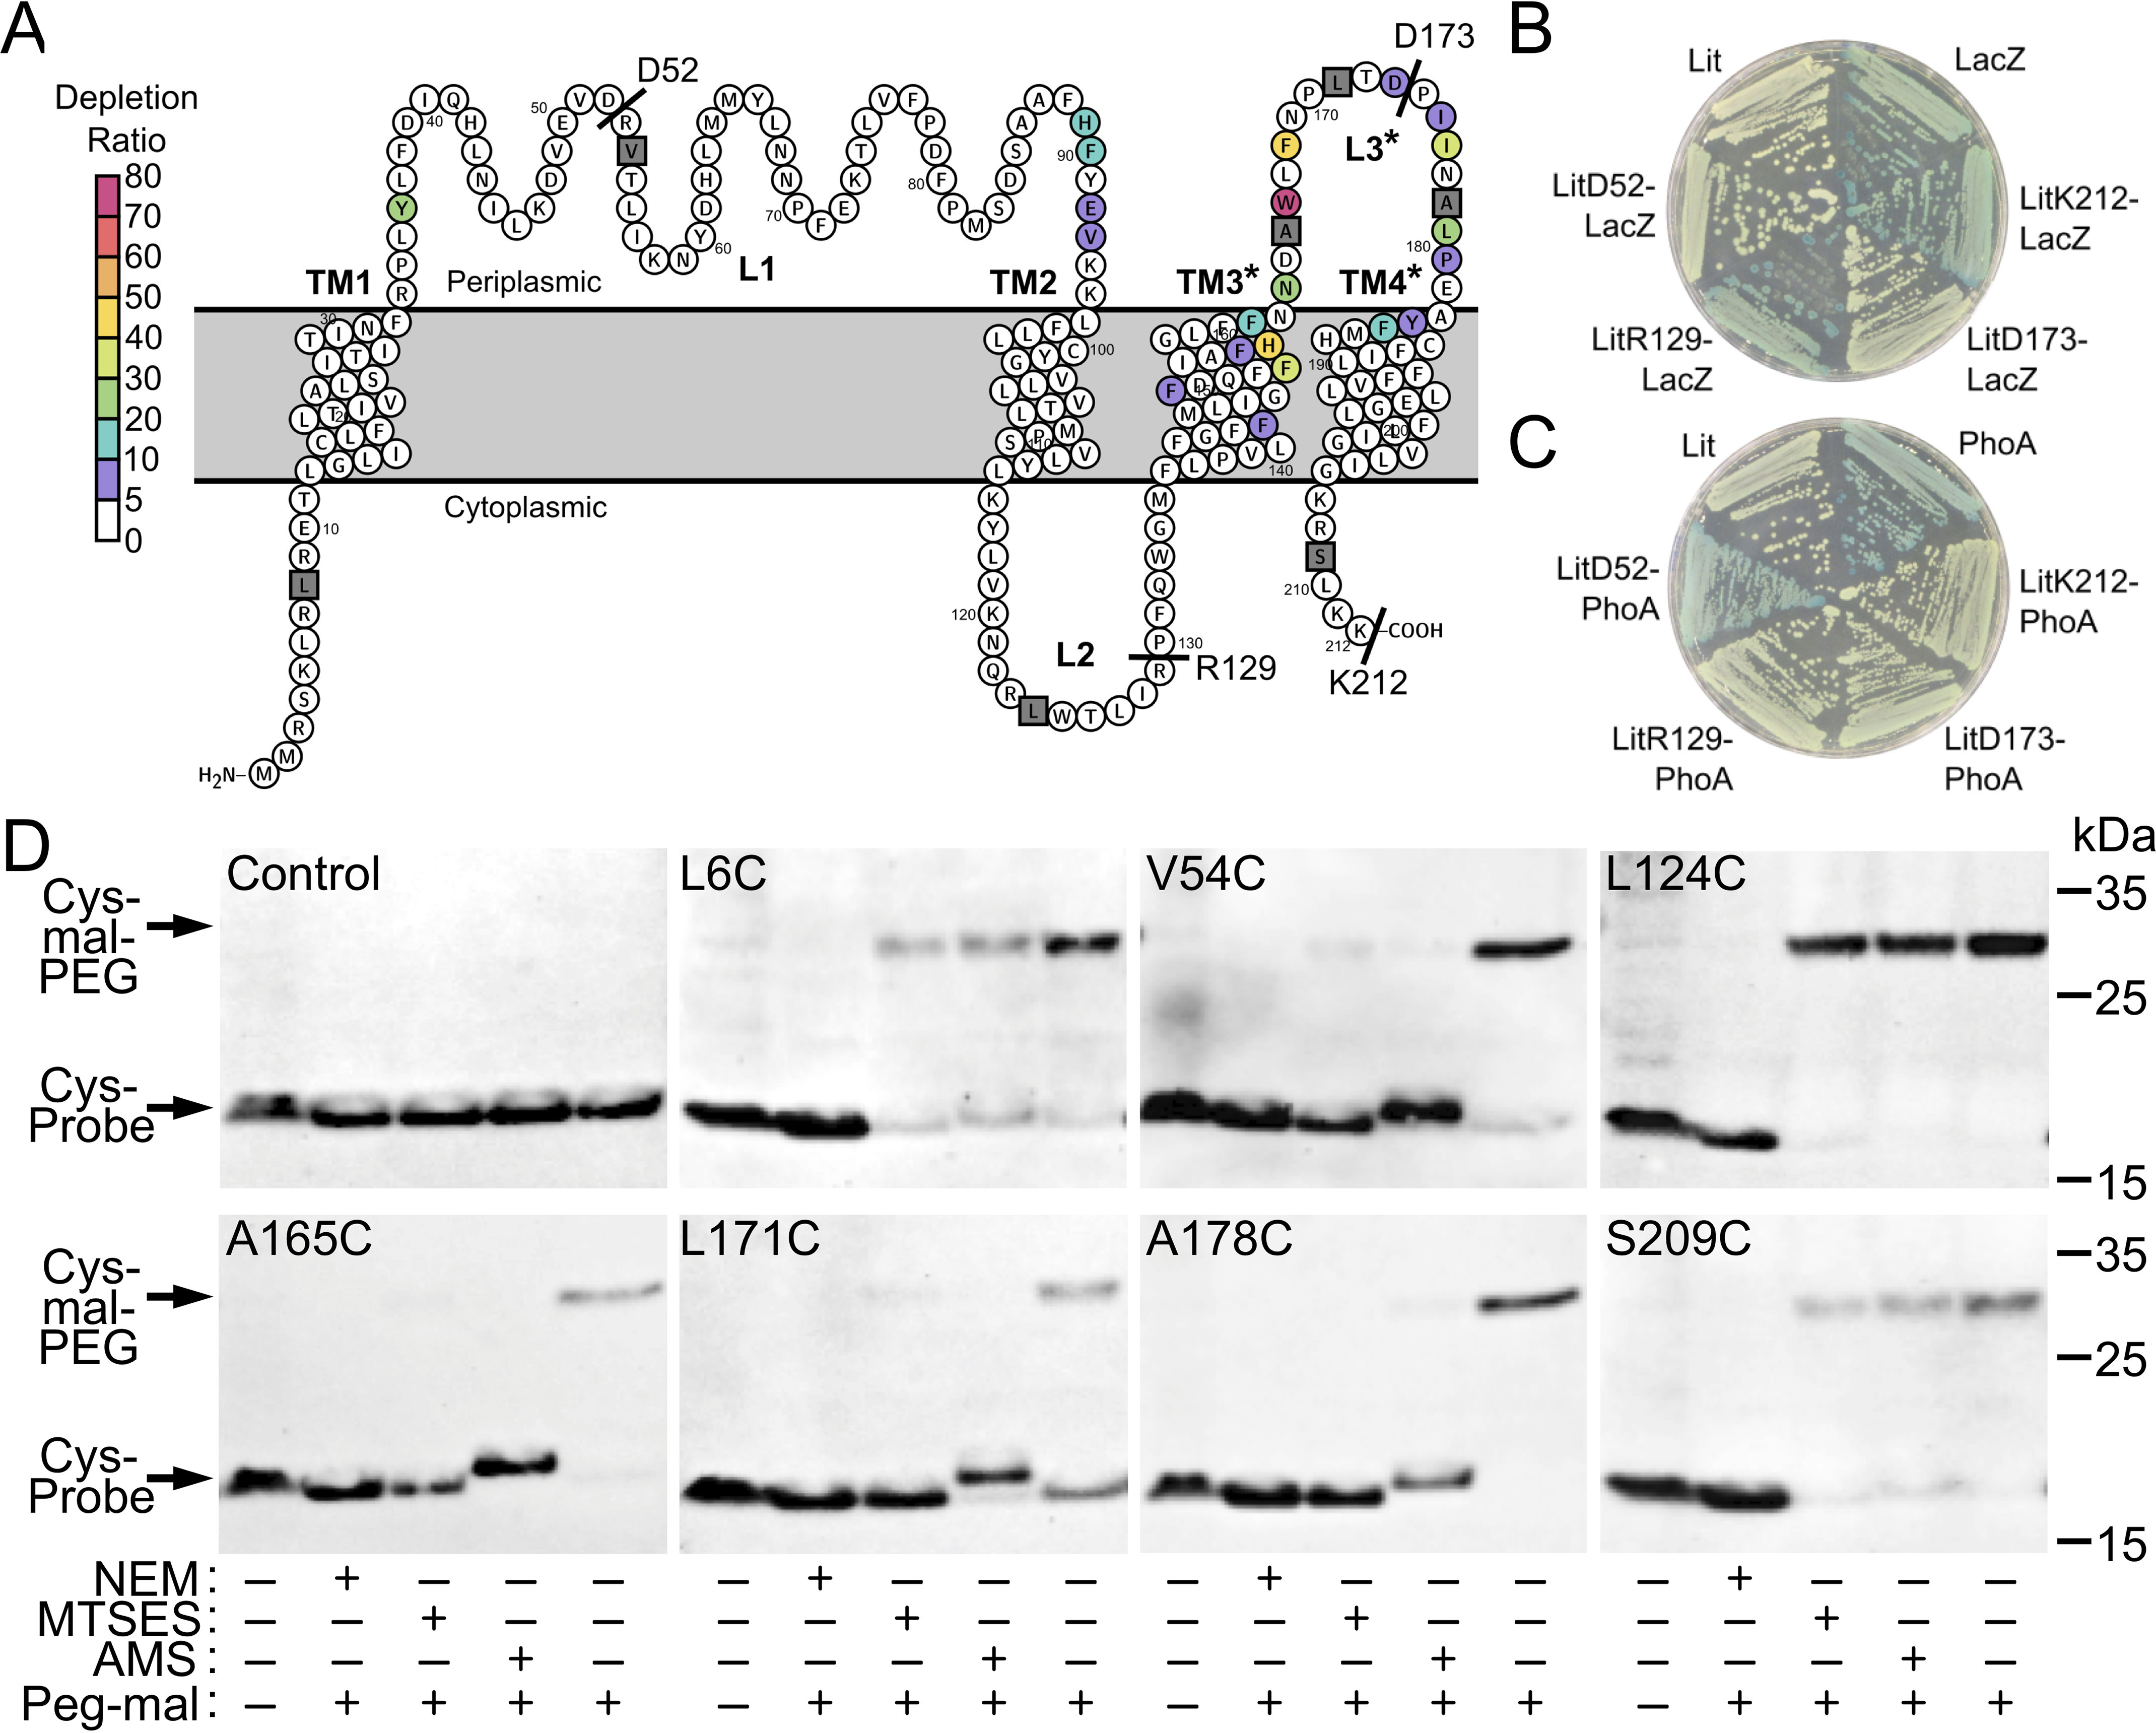
Membrane topology of Lit. A, the membrane topology of Lit as predicted by Protter (26). Uncertainty in membrane boundaries is denoted by an asterisk (*) on TM passes TM3 and TM4, and periplasmic loop L3 (see Table S2). Depletion ratios determined by Mut-seq analysis are indicated (see Fig. 6). The position of LacZ and PhoA C-terminal fusions are labeled with text, whereas positions probed using the SCAM are gray squares. B, strains expressing native Lit (SS851), native LacZ (SS904), and the fusions LitD52-LacZ (SS951), LitR129-LacZ (SS935), LitD173-LacZ (SS932), and LitK212-LacZ (SS915) were struck on solid media containing X-gal. Blue colonies (LacZ, LitR129-LacZ, or LitK212-LacZ) indicate active LacZ localized in the cytoplasm. C, strains expressing native Lit (SS851), native PhoA (SS964), and the fusions LitD52-PhoA (SS950), LitR129-PhoA (SS936), LitD173-PhoA (SS940), and LitK212-PhoA (SS916) were struck on solid media containing the alkaline phosphatase colorimetric indicator BCIP. Blue colonies (PhoA and LitD52-PhoA) indicate active PhoA localized in the periplasm. Neither of the predicted loop 3 fusions (LitD173-lacZ or LitD173-PhoA) demonstrated activity. D, SCAM was used to determine topology at the indicated positions (gray squares in panel A) in a strep-tagged Lit construct lacking all endogenous cysteine residues (C16A, C100A, C187A). Cells expressing Lit variants with a single cysteine residue were either unlabeled (−, first column) or labeled (+, second to fifth columns) with mal-PEG (average molecular mass 5,000 Da). Samples labeled with mal-PEG were pretreated with either a membrane permeable NEM or impermeable MTSES or AMS thiol reactive probe as indicated (+/−). Cells were lysed and protein extracts were separated by SDS-PAGE before detection of Lit with α-strep tag-specific antibody. Formation of Lit-mal-PEG adducts (higher molecular weight) occurs provided the cysteine residue is inaccessible to probe in whole cells (55, 56).