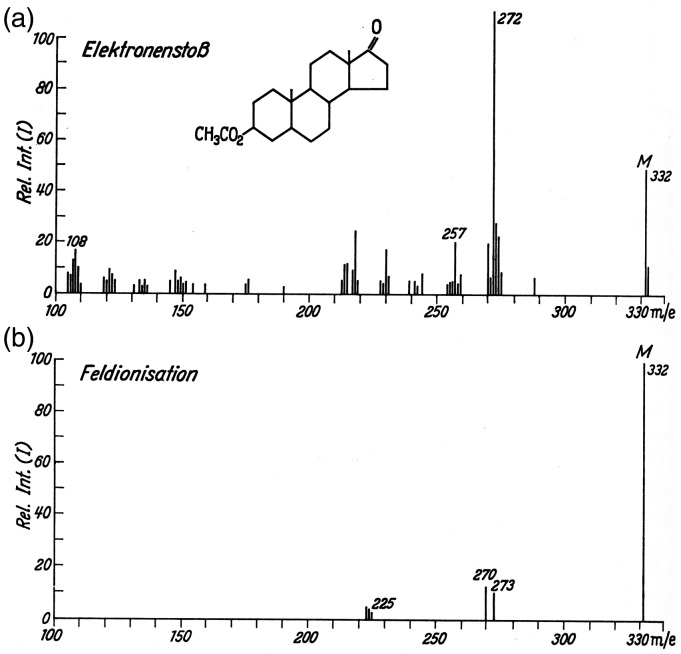
Figure 1.
Mass spectra of 5α-androstan-3β-17-on-acetate as obtained by (a) 70 eV EI and (b) FI. In (b) the non-resolved pair of peaks at m/z 332 and 333 are represented as the sum of their intensities. Notes: i) To preserve the original character of the figure the peak labels have not been corrected to become M+• and the abscissas are still labeled m/e rather than dimensionless m/z. ii) For a brief discussion of the spectrum cf. Example 2 in Ion Formation Processes in Field Ionization. Reproduced from Ref. [12] by kind permission. © Springer Nature, Heidelberg, 1965.

