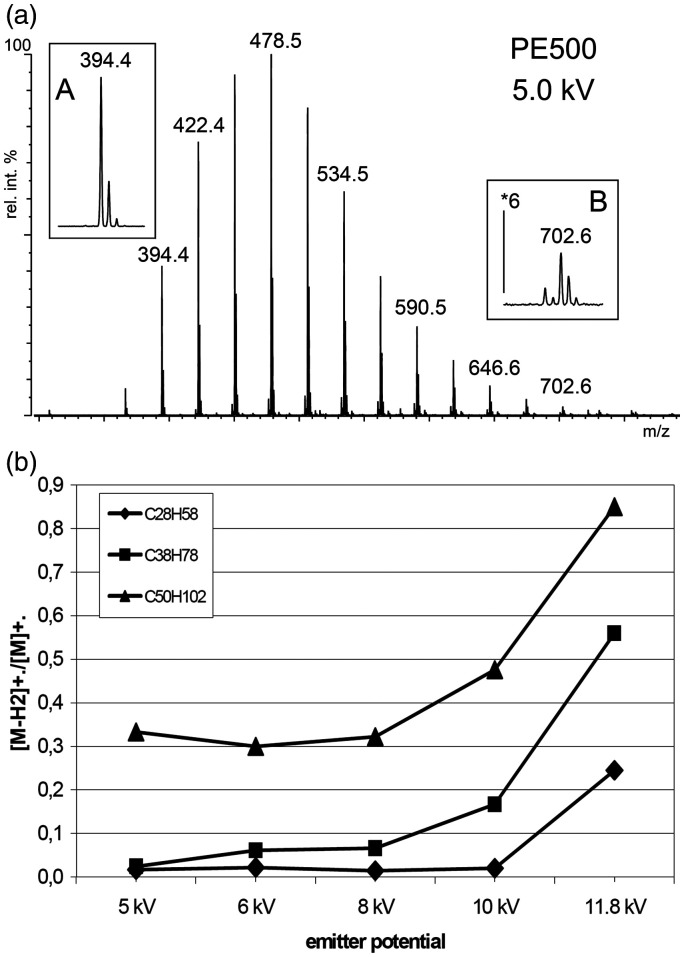
Figure 20.
Hydrocarbon analysis by FD-MS. (a) The FD mass spectrum of polyethylene 500 at an emitter voltage of 5 kV shows no H2 loss from C28H58+•, m/z 394.4 (inset A), but notable loss from C50H102+•, m/z 702.6 (inset B). (b) The ratio of [M–H2]+•/M+• increases along with the emitter potential. © Reproduced from Ref. [193] with kind permission. © SAGE Publishing, 2000.

