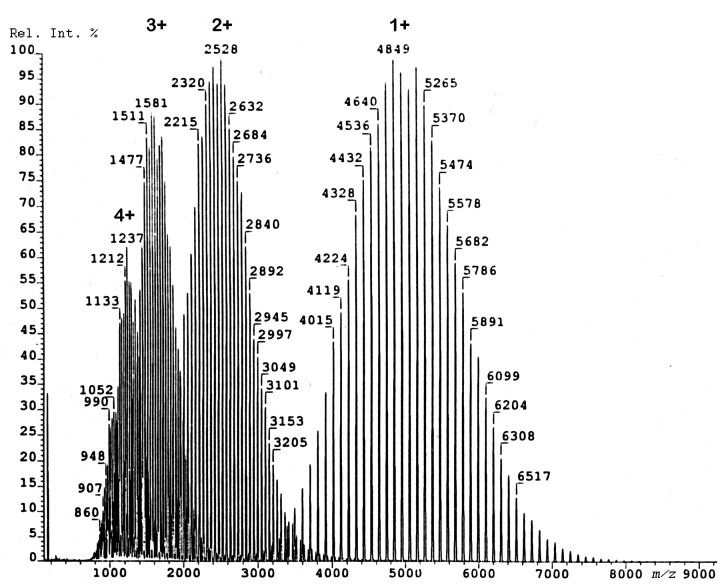
Figure 21.
FD mass spectrum of a polystyrene sample of average molecular weight of 5100 u. In this case, the molecular weight distribution is not only represented by the singly charged molecular ions but also by partially overlapping series of doubly, triply, and even quadruple charged ions. Reproduced from Ref. [190] with kind permission. © John Wiley & Sons, 1990.

