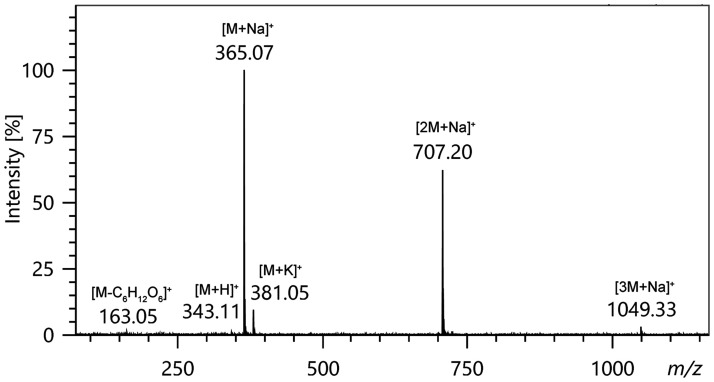
Figure 22.
The LIFDI mass spectrum of saccharose mainly shows ions due to alkali adduct formation. Saccharose was applied as solution (ca. 1mg ml−1 in water: methanol = 1: 2) and the spectrum was acquired while ramping the EHC at 20 mA min−1. This spectrum is an experimental representation of the ion desolvation process as depicted in Figure 14.

