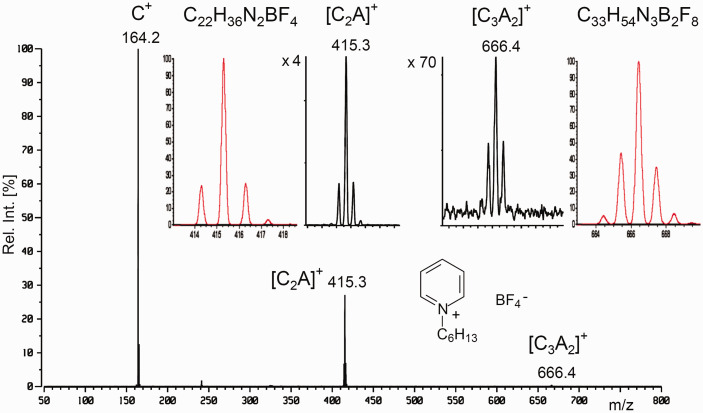
Figure 23.
LIFDI mass spectrum of N-hexylpyridinium tetrafluoroborate in methanol at a concentration of 0.1 µl ml−1 scanned over the m/z 50–800 range. The insets show the [C2A]+ and [C3A2]+ cluster ions for comparison of the experimental and calculated isotopic patterns. Reproduced from Ref. [139] with kind permission. © American Chemical Society, 2007.

