Figure 2.

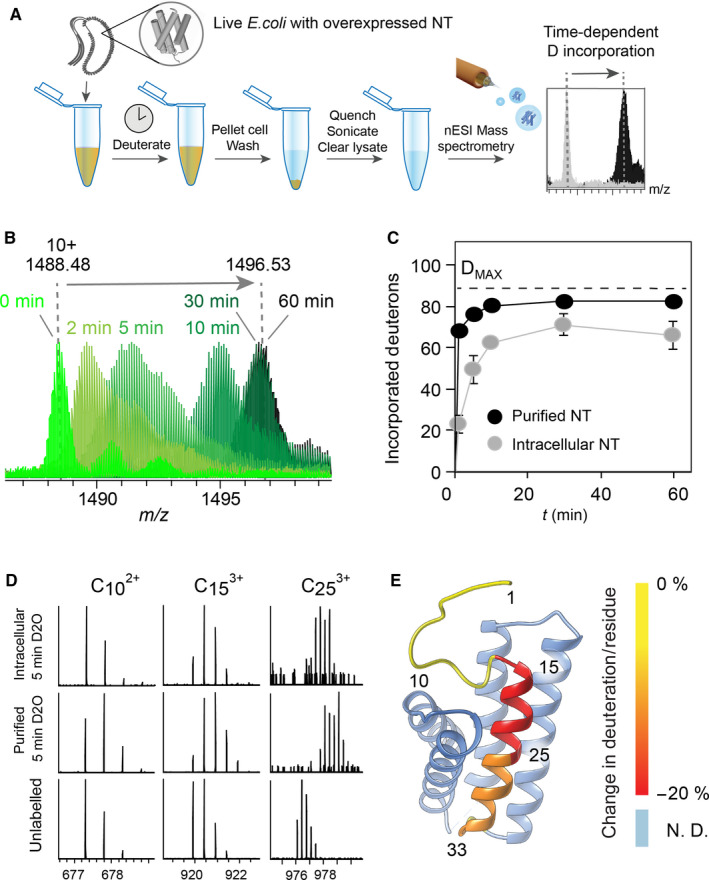
Intracellular NT adopts a tight fold. (A) Schematic representation of the in‐cell HDX‐MS strategy. Live Escherichia coli overexpressing NT are suspended in deuterated PBS. At each time‐point, the exchange is quenched by addition of 10% formic acid, the cells are lysed by sonication, and the soluble fraction is isolated by centrifugation and subjected to direct MS analysis. (B) Overlaying the 10+ charge state in mass spectra of NT deuterated for 0–60 min inside live E. coli shows how the protein shifts to the higher m/z region with increasing incubation time, indicating time‐dependent deuteration. (C) Absolute deuterium uptake of purified NT (black circles) and NT in live E. coli (grey circles) plotted against deuteration time shows slower and lower labelling of the intracellular protein. Error bars indicate standard deviations (n = 6). (D) Deuterated NT was subjected to top‐down sequencing by ETD to reveal the local deuterium uptake in the N‐terminal region of NT. ETD fragments covering residues 1–10, 1–15 and 1–25 show slower deuterium uptake in the intracellular protein than in the purified protein. (E) The relative difference in deuterium uptake between purified and intracellular NT after 5 min of deuteration in solution and inside cells was calculated from the ETD fragments and mapped on the protein structure using ucsf chimera 45. The colour shift from yellow (no difference protection) to red (increased protection inside cells) shows increased protection of helix 1 in the intracellular protein.
