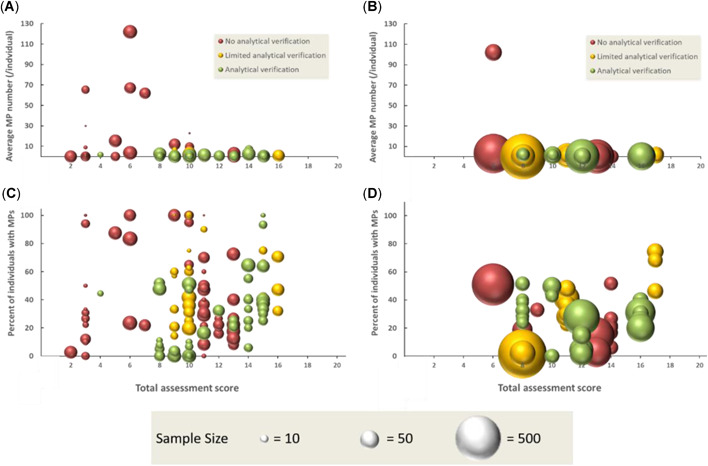
Figure 5.

Relationship between the total assessment score and studies that reported on (A) average number of microplastic particles/individual with sample sizes <50, (B) sample sizes >50, (C) frequency of occurrence of microplastic in organisms with sample sizes <50, and (D) with sample sizes >50. Also illustrated is an indication of studies that included some level of analytical verification based on the scoring system defined by Hermsen et al. (2018); no analytical verification is indicated by red, limited analytical verification by yellow, and full verification by green. The relative sample size of each study is also illustrated, scaled to the largest sample size included in the analysis (n = 734). MP = microplastic.
