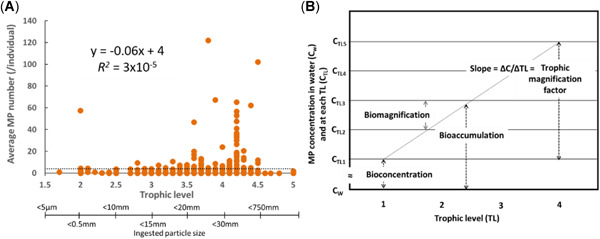
Figure 7.

Relationship between (A) average number of microplastic particles (MP) ingested/individual and their relative trophic level (TL; n = 517) and (B) the various bioaccumulation metrics, where bioconcentration reflects an increase in the organism concentration relative to the water concentration; biomagnification reflects an increase in organism concentration from one trophic level to higher levels; bioaccumulation reflects an increase in organism concentration relative to both the water concentration and dietary concentration; and trophic magnification factor reflects the relative change in organism concentration across a number of trophic levels (modified from Mackay et al. 2013). It is notable that as trophic level increases, the particle size distribution of particles ingested by an organism also changes, as does the efficiency of particle egestion. Average microplastic particle concentration across all data is 4 particles/individual (dotted line) and typically ranges between 0 and 10 particles/individual. The elevated numbers illustrated for trophic level 4.2 are entirely based on results reported for Fulmarus glacialis, representing the species with the highest propensity for ingesting plastic debris and microplastic particles.
