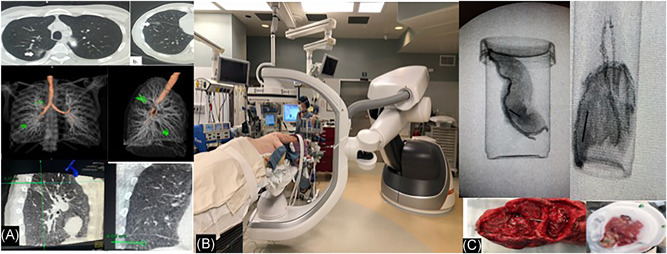
Figure 2.

A, Axial computed tomography (CT), 3D volume rendered and sagittal and coronal cone beam CT images, of patient with two nodules resected in the same procedure; the size, morphology location, and T‐bar path (green lines) are depicted [Color figure can be viewed at wileyonlinelibrary.com]
