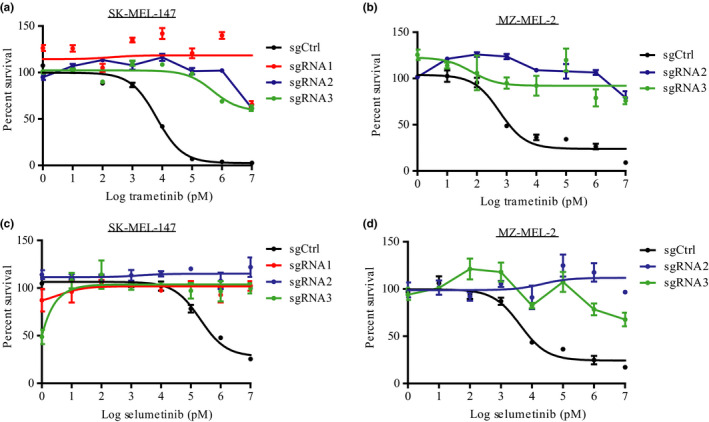
Figure 2.

FBXO42 KO leads to MEKi resistance in NRAS mutant cell lines. (a‐d) Dose–response curves generated using SK‐MEL‐147 and MZ‐MEL‐2 cell lines treated with trametinib or selumetinib (1 pM–10 μM) for 72 hr before assessing cell viability using Cell Titer‐Glo Luminescent Cell Viability Assay (n = 3). The relative cell number post‐trametinib treatment is plotted as percent survival versus log trametinib concentration in pM. Error bars, SD
