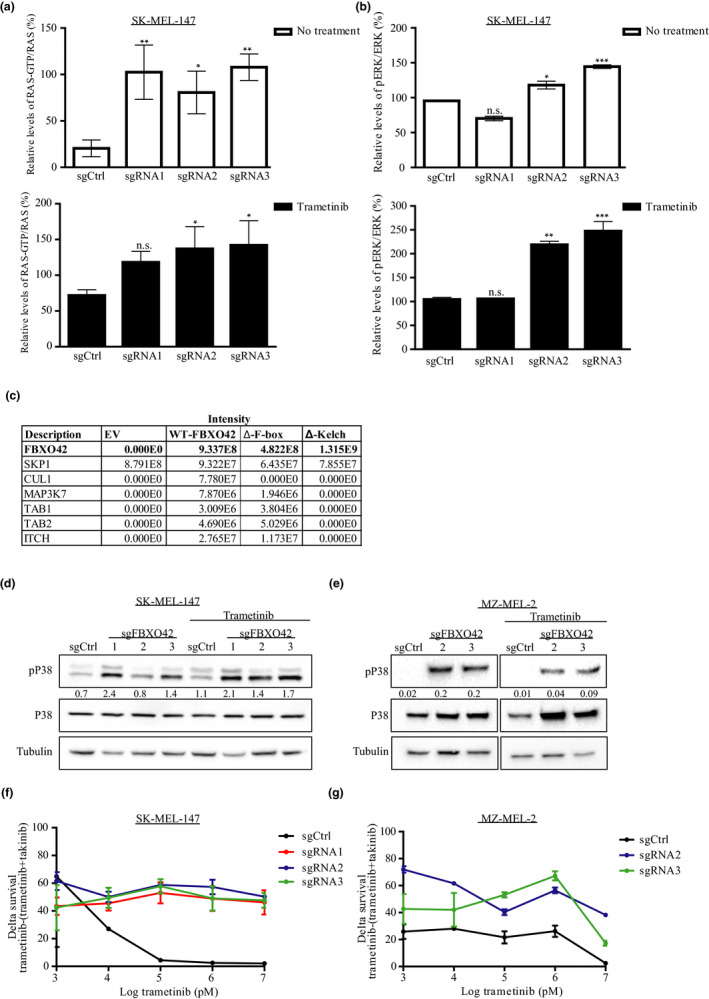
Figure 5.

FBXO42 KO activates the MAPK pathway and TAK1 signaling leading to trametinib resistance. (a) SK‐MEL‐147 RAS‐GTP levels were assessed by RAS pull‐down assay, and treated samples were incubated with 100 nM trametinib for 24 hr. RAS‐GTP/RAS ratios are representative of three independent experiments. Trametinib‐treated and non‐treated samples were compared to their sgCtrl. n = 3, *p < .05, **p < .01 one‐way ANOVA followed by Tukey's test. (b) SK‐MEL‐147 cells were treated with 100 nM trametinib for 24 hr. Cell lysates were analyzed by immunoblot. pERK/ERK ratios were calculated from two independent experiments. Untreated samples were blotted with non‐sensitive ECL; trametinib‐treated samples were blotted with sensitive ECL. Trametinib‐treated and non‐treated samples were compared to their sgCtrl. n = 2, *p < .05, **p < .01, ***p < .001, one‐way ANOVA followed by Tukey's test. (c) Cells stably expressing FLAG‐FBXO42 were immunoprecipitated with anti‐Flag. Bound proteins were eluted and analyzed by mass spectrometry. The identified proteins are listed. FLAG‐FBXO42ΔKelch and FLAG‐FBXO42ΔF‐box were used as control. (d,e) SK‐MEL‐147 and MZ‐MEL‐2 cell lines were treated with 100 nM trametinib for 24 hr. Cell lysates were analyzed by immunoblot with the indicated antibodies. pP38/P38 ratios were generated using Image Lab (Bio‐Rad). (f,g) Dose–response curves generated using SK‐MEL‐147 and MZ‐MEL‐2 cell lines, representing the delta between cells treated with trametinib (0.001–10 μM) and cells treated with the combination of trametinib (0.001–10 μM) and takinib (2.5 or 5 μM, respectively). Error bars, SD
