Figure 1.

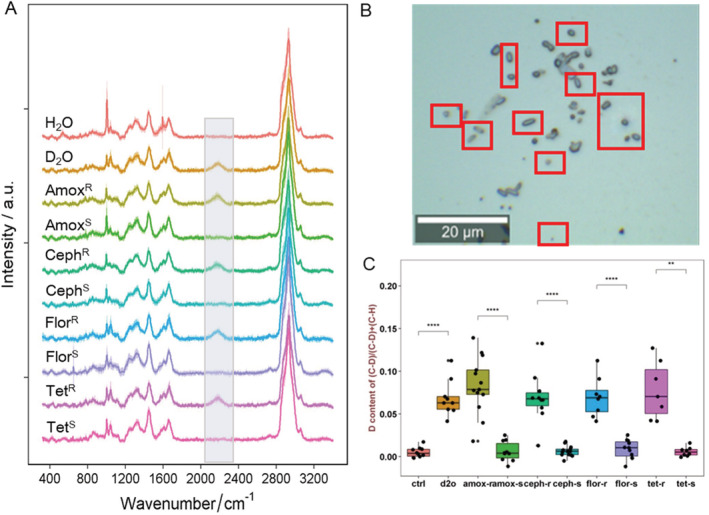
A. Single‐cell Raman spectra (SCRS) of human intestinal bacteria after in situ culturing with H2O, D2O, D2O + amoxicillin, D2O + cephalexin, D2O + florfenicol or D2O + tetracycline for 24 h at 37°C anaerobically (R: metabolic active resistant strain; S: susceptible strain). The C–D band (2070–2300 cm−1) is highlighted. Each spectrum represents an average of SCRS from 80 to 300 single‐cells, and the shadow represents standard deviation of SCRS.B. A microscopic field view of intestinal bacteria community with D2O + cephalexin (2 × MIC), showing the microorganisms with C–D metabolic activity (red squares).C. The intensity ratio of C–D/(C–D + C–H) in each SCRS of bacteria cells in Fig. 1A. Student t‐test was used to indicate statistical differences between R and S strain. *P < 0.05, **P < 0.01, ***P < 0.001, ****P < 0.0001.
