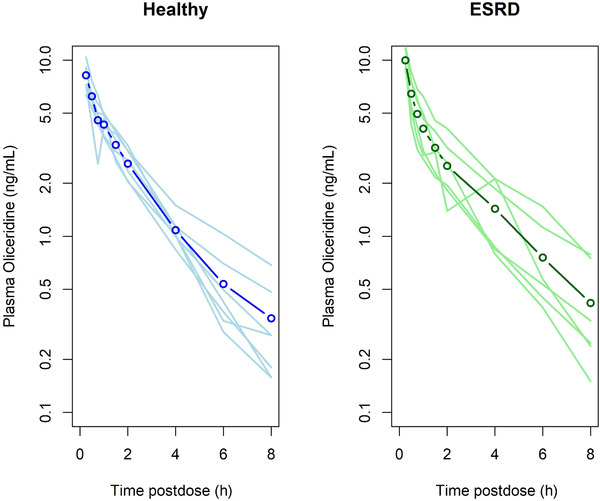
Figure 1.

Dose‐normalized mean plasma oliceridine concentration‐vs‐time profiles in healthy subjects with normal kidney function (left panel) and in patients with end‐stage renal disease (right panel). The heavy line with open circles represents the mean concentration for each group. The lighter solid lines are the individual plasma concentration‐vs‐time curves for each individual in the group.
