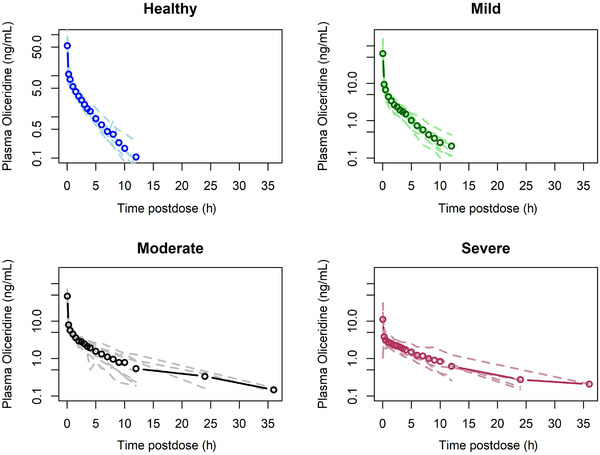
Figure 2.

Dose‐normalized mean plasma oliceridine concentration‐vs‐time profiles in mild (n = 8), moderate (n = 8), and severe (n = 6) hepatic impairment, compared with healthy subjects (n = 8). The heavy line with open circles represents the mean concentration for each group. The lighter dashed lines are the individual plasma concentration‐vs‐time curves for each individual in the group.
