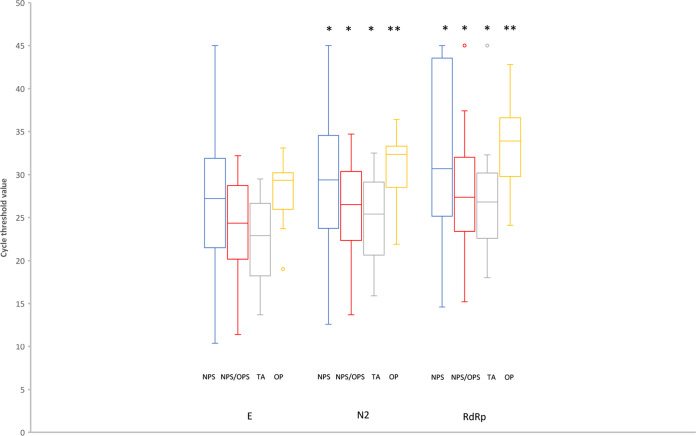
FIG 1.
Distribution of Xpert Xpress SARS-CoV-2 CT values in concordant positive specimens. Twelve specimens inconclusive by the New York EUA method and 21 specimens tested at Rutgers University Hospital are not included because the EUA version of the Xpert test was used (no RdRp target). The box center lines are medians. The boxes represent upper and lower quartiles. The bars represent minimum and maximum values, except for RdRp NPS/OPS and RdRp TA, where the maximum values are outliers. *, P < 0.0001 for comparison with the E target; **, P = 0.005 for comparison with the E target.

