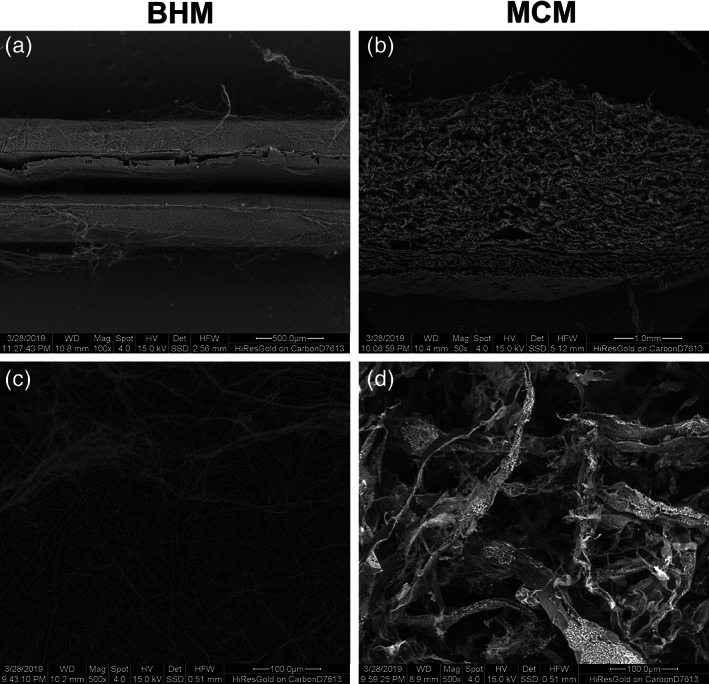
Figure 3.

SEM analysis of BHM and MCM. Microscopic structural characteristics of MCM and BHM observed at different projections. Panels (a) and (b) show the cross‐sections of the analyzed materials (a = BHM) and (b = MCM) and panels (c) and (d) show the spongy surface of BHM and MCM surface separately. Scale bar is given for each picture
