Figure 4.

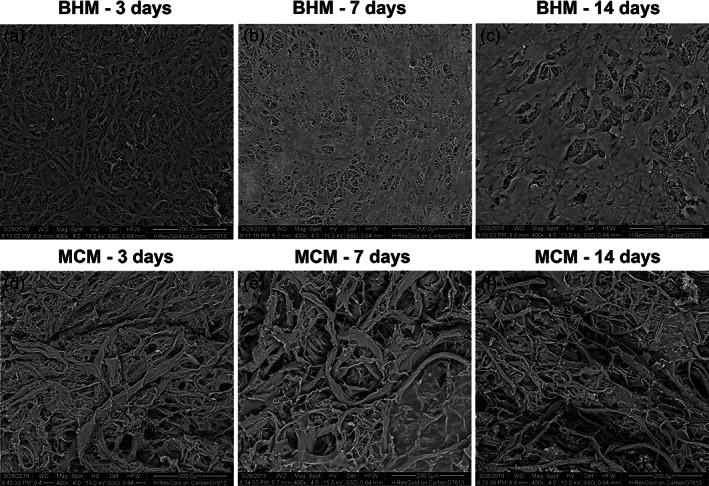
Scanning electron microscopy analysis of hGFs grown on BHM and MCM. HGFs after (a, d) 3, (b, e) 7, and (c, f) 14 days of culture. Scale bar = 200 μm

Scanning electron microscopy analysis of hGFs grown on BHM and MCM. HGFs after (a, d) 3, (b, e) 7, and (c, f) 14 days of culture. Scale bar = 200 μm