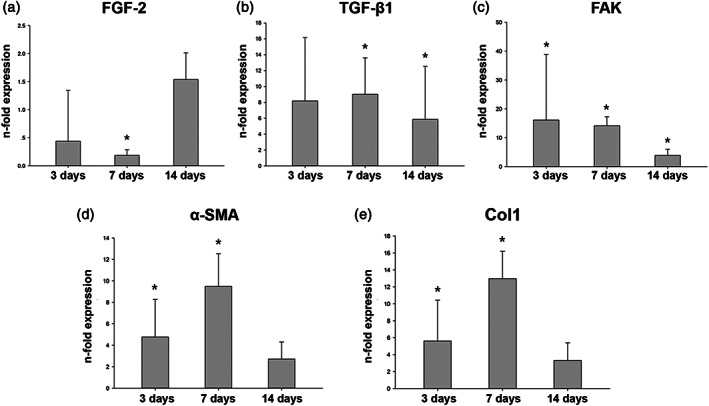
Figure 5.

Gene expression analysis of hGFs grown on BHM. Expression of FGF‐2, TGF‐β1, FAK, Col1, α‐SMA in hGFs grown on BHM at 3, 7, and 14 days: (a) FGF‐2; (b) TGF‐β1; (c) FAK; (d) Col1; (e) α‐SMA. Y‐axis represents the n‐fold expression levels of the target gene in relation to cells in TCP group (control) calculated by 2−ΔΔCt method. Data are presented as mean ± SEM of five independent experiments with hGFs of five different donors (n = 5), *significant difference between groups as tested by Wilcoxon test (p < .05)
