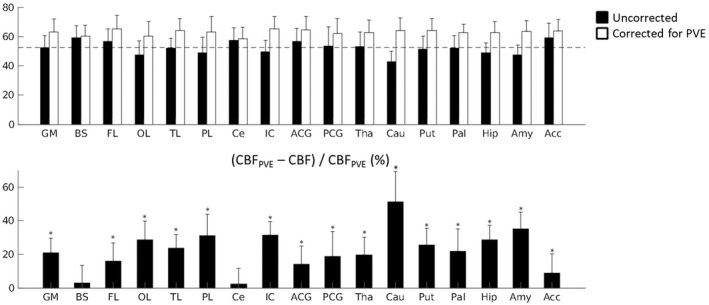
FIGURE 4.

Top: Group averaged (N = 29) regional CBF values for elderly participants of the Rotterdam Scan Study, uncorrected and corrected for partial volume estimates of gray matter (GM). The error bars indicate the standard deviation across the group. The dotted line indicates the group averaged, uncorrected value for whole brain grey matter CBF. Bottom: The percentage in CBF per ROI after partial volume correction. GM = gray matter, BS = brainstem, FL = frontal lobe, OL = occipital lobe, TL = temporal lobe, PL = parietal lobe, Ce = cerebellum, Ins = insular cortex, ACC = anterior cingulate cortex, PCC = posterior cingulate cortex, Tha = thalamus, Cau = caudate nucleus, Put = putamen, Pal = pallidum, Hip = hippocampus, Am = amygdala, Ac = Accumbens. *Significantly larger than 0, P < .001. (Bonferroni‐corrected P‐value = .0029)
