
Fig. 3.
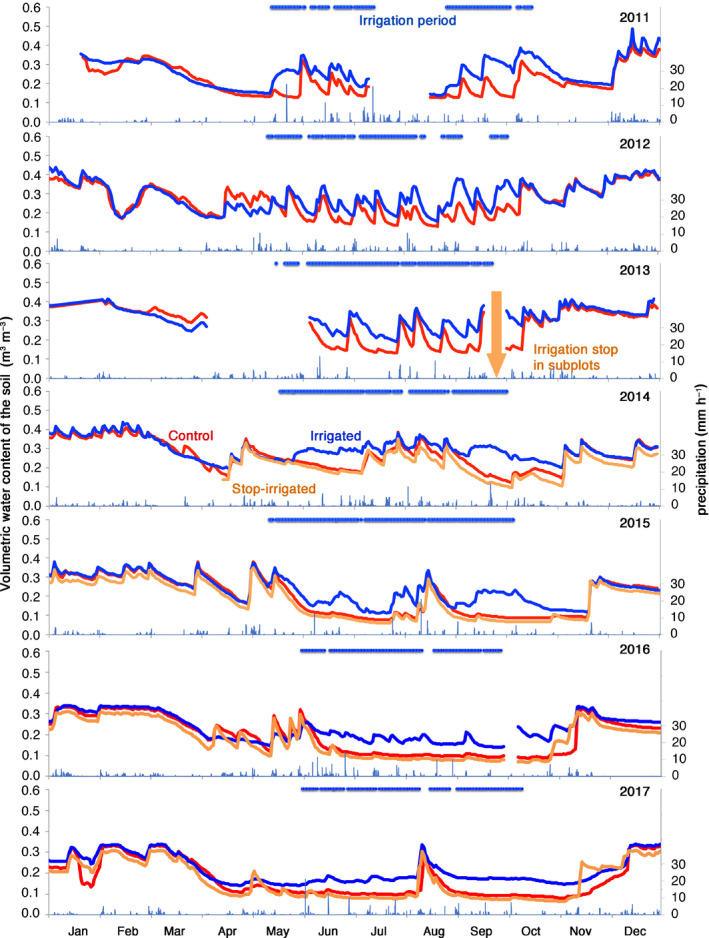
Mean daily time courses of soil volumetric water content (10–80 cm) in control plots (no irrigation, red), irrigated plots (blue) and plots where irrigation was stopped at the end of 2013 after 11 yr of treatment (orange). The irrigation was active during the nonfreezing period of the year. Periods of missing irrigation during the irrigation period indicate outages of the irrigation system (blue horizontal line). Data resolution: 1 h.