
Figure 3.
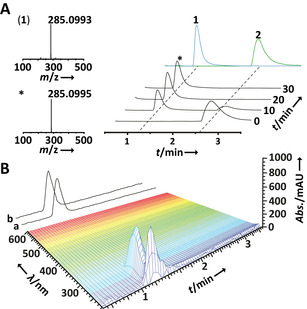
A) Progress of the gram‐scale synthetic/biocatalytic production of 1 from 2, as verified by UHPLC and HR‐ESIMS analyses of an aliquot. Top trace: overlaid individual chromatograms of authentic 1 and 2. B) 3D plot of UHPLC diode array and total ion chromatogram (TIC) data of the singly chromatographed 1 production assay. TIC trace a) ESI (+); trace b) ESI (−) mode.